What the 4.7% U.S. July 2026 PPI Means and Fed Outlook
The U.S. Producer Price Index for July 2026 rose 4.7% year over year and was unchanged at 0.0% month over month, coming in below market expectations. However, there is no fixed lag between PPI and CPI, and the Fed's interest rate decisions must also be assessed in light of employment, PCE inflation, and financial conditions.
- The U.S. final demand PPI for July 2026 rose 4.7% year over year but remained unchanged at 0.0% month over month.
- Core PPI, excluding food and energy, rose 4.2% year over year and 0.2% month over month.
- A slowdown in the annual rate of increase does not mean prices fell; it means prices rose at a slower pace.
- PPI is not a mechanical indicator that leads CPI by 2–3 months; the composition of items, corporate margins, import prices, and base effects must also be examined.
- A lower-than-expected PPI may reduce pressure to raise interest rates, but a single release cannot determine the timing or size of the Fed's rate cuts.
The U.S. Producer Price Index (PPI) for July 2026 showed that the pace of growth in selling prices received by businesses eased from the previous month. It is encouraging that neither the headline nor core measure showed a sharp reacceleration, but this should not be directly interpreted as a decline in consumer prices or a Federal Reserve rate cut.
July 2026 U.S. PPI Results
The following compares the U.S. Bureau of Labor Statistics’ final-demand PPI figures with market expectations. Market expectations may vary depending on the survey organization and aggregation timing, while previous figures may be revised later.
| Category | July Result | Market Expectation | Previous Figure | Interpretation |
|---|---|---|---|---|
| Headline PPI, year over year | 4.7% | 4.9% | 5.5% | Lower than expected, with the annual rate slowing |
| Headline PPI, month over month | 0.0% | 0.2% | -0.1% | Broadly unchanged from the previous month on a seasonally adjusted basis |
| Core PPI, year over year | 4.2% | 4.2% | 4.7% | In line with expectations and slower than previously |
| Core PPI, month over month | 0.2% | 0.3% | 0.4% | Lower than expected, with the short-term pace of growth easing |
Here, 4.7% year over year means that producer price levels were 4.7% higher than a year earlier. A decline from 5.5% to 4.7% does not mean that prices themselves fell. Prices were still higher than a year earlier, but their pace of increase slowed.
A month-over-month reading of 0.0% also does not mean that the prices of all items were unchanged. Some items may rise while others fall, leaving the overall index flat on a rounded basis.
What the PPI Actually Measures
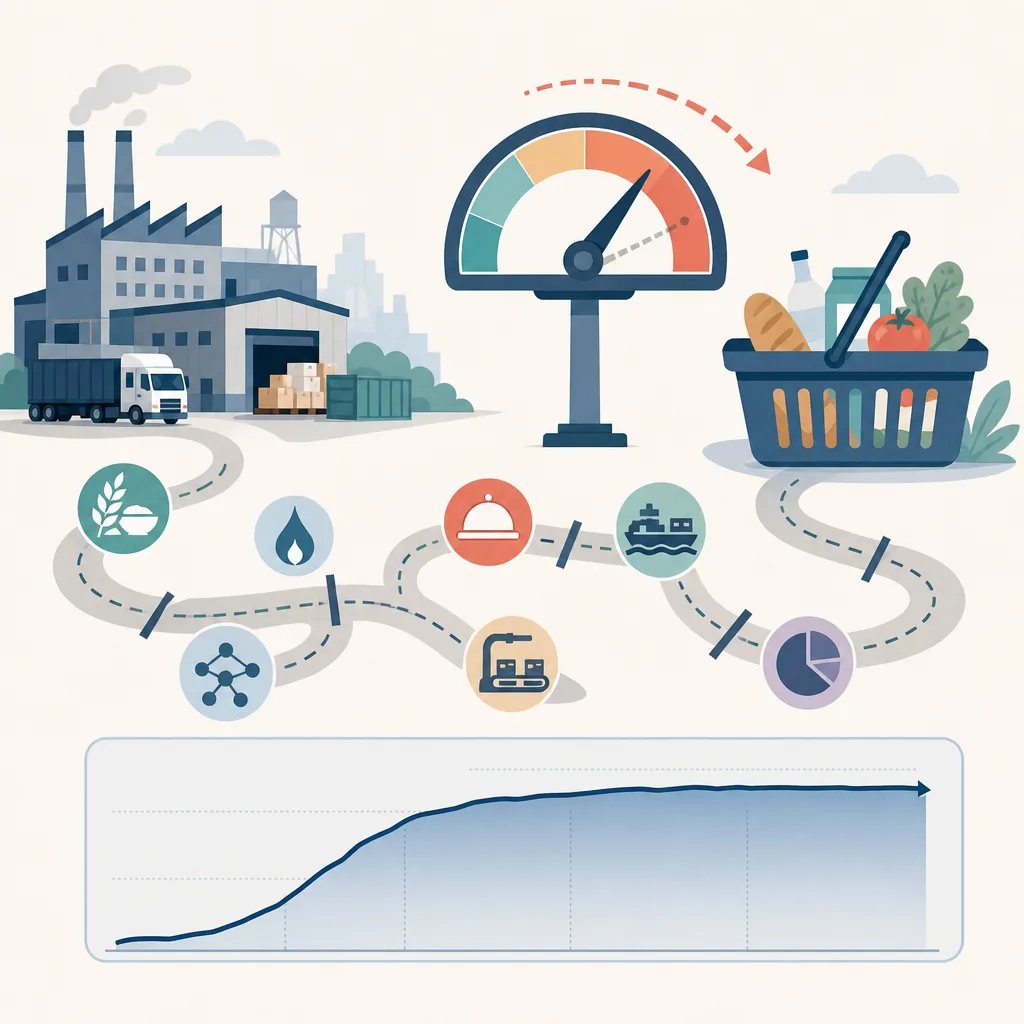
The PPI measures the average change in prices received by U.S. domestic producers when they sell goods and services. It is often referred to as a measure of manufacturing or wholesale prices, but the U.S. final-demand PPI includes not only goods but also services and construction.
The following distinctions are important when interpreting the PPI.
- Headline PPI: Reflects prices for total final demand, including food and energy.
- PPI excluding food and energy: Excludes these two volatile categories to assess the underlying trend.
- Measure excluding food, energy, and trade services: Another supplementary measure used to assess underlying pressures by also excluding fluctuations in distributors’ margins.
- Final demand and intermediate demand: Final demand focuses on output sold to final purchasers, while intermediate demand focuses on inputs purchased by businesses during the production process.
Therefore, comparing figures based only on the term “core PPI” can lead to confusion between indicators with different exclusions. The release should be checked to determine whether it excludes only food and energy or also trade services.
Can This Be Viewed as Inflation Peaking?
The July figures provide evidence that inflationary pressure at the producer level eased from the previous period. This is because the year-over-year headline rate fell from 5.5% to 4.7%, while the month-over-month index was flat.
However, it is difficult to confirm that inflation has passed its peak based on a single month’s data.
- Base effects are at work. If the comparison level from a year earlier is high or low, the year-over-year rate can change even when current prices do not change substantially.
- Monthly figures may be revised. Previous values may be adjusted to reflect seasonal adjustments and additional data.
- Goods and services may move in different directions. Energy price declines may lower the headline figure while service prices remain strong.
- Tariff and supply-chain shocks appear with a lag. If businesses absorb higher costs, the effects may not immediately appear in the PPI or CPI, and margins may decline first.
It is therefore safer to assess whether inflation has peaked by examining at least several months of monthly trends together with detailed goods and services categories.
Does the PPI Lead the CPI by 2–3 Months?
The PPI can move ahead of the CPI, but there is no fixed formula under which it is “always reflected in the CPI 2–3 months later.” The two indexes differ in their survey populations and weights.
| Category | PPI | CPI |
|---|---|---|
| Price perspective | Selling prices received by domestic producers | Prices paid by consumers |
| Main survey coverage | Producer transactions involving goods, services, and construction | Goods and services purchased by households |
| Treatment of imports | Does not directly measure imports | May reflect imported final goods purchased by consumers |
| Distribution margins | Measured as margins in some trade services | Included in the final retail prices paid by consumers |
| Housing costs | Structured differently from the CPI | Rent and housing costs have a large weight |
If declines in businesses’ input costs are passed through to final selling prices, a slowdown in the PPI may later lead to a slowdown in the CPI. Conversely, if services such as wages, rent, and insurance, whose treatment differs between the PPI and CPI, remain strong, the two indexes may move in different directions for a considerable period.
Some detailed PPI components are also used to calculate the Personal Consumption Expenditures (PCE) price index. Because the Federal Reserve focuses more on PCE inflation than the CPI when assessing its policy objective, it is also important to determine which PPI components feed into the PCE.
How to Test the Oil Price and Chinese Import Hypotheses
It is possible for overall producer prices to remain stable while oil prices rise. This can occur because higher oil prices are not immediately passed through to other goods and services, or because price declines in other items offset the increase in energy prices. Businesses may also absorb higher costs through their profit margins rather than reflecting them in selling prices.
The claim that increased imports of Chinese goods lowered U.S. inflation may also be a valid hypothesis, but the PPI alone cannot prove it. This is because the U.S. PPI measures prices received by U.S. domestic producers, so the prices of Chinese imports are not directly included in the index.
The following data should be examined together to test the hypothesis.
- The U.S. Census Bureau’s value and volume of imports from China
- The U.S. Bureau of Labor Statistics’ import price index for Chinese goods
- Effective dates and covered products for tariff changes
- Business inventories and whether goods were shipped early or exports were front-loaded before tariffs were imposed
- PPI prices for intermediate demand and trade-services margins
- CPI categories with a high share of imports, such as household furnishings and apparel
An increase in import value may result not only from lower prices but also from higher import volumes, exchange rates, or inventory accumulation before tariffs are imposed. A simultaneous increase in imports from China and slowdown in the PPI during a particular month should not, by itself, be treated as proof of causation.
How Financial Markets React Immediately After the Release
A lower-than-expected PPI generally tends to lower the market’s expected policy-rate path. In that case, short-term Treasury yields and the dollar may fall, while growth stocks that are sensitive to lower discount rates may strengthen.
However, the actual market reaction depends on the following factors.
- How much had already been priced in before the release
- Employment, consumption, and unemployment claims data released at the same time
- The composition of detailed inflation categories, such as energy and services
- Remarks by Federal Reserve officials and the next PCE release
- Tariffs, geopolitical risks, and Treasury issuance conditions
Even if Treasury yields and the dollar fall immediately after the PPI release, it is difficult to attribute the entire move to the PPI alone. Tools such as CME FedWatch merely provide market-implied probabilities derived from futures prices, not official Federal Reserve projections or confirmed decisions.
Impact on the Federal Reserve’s Rate Decision
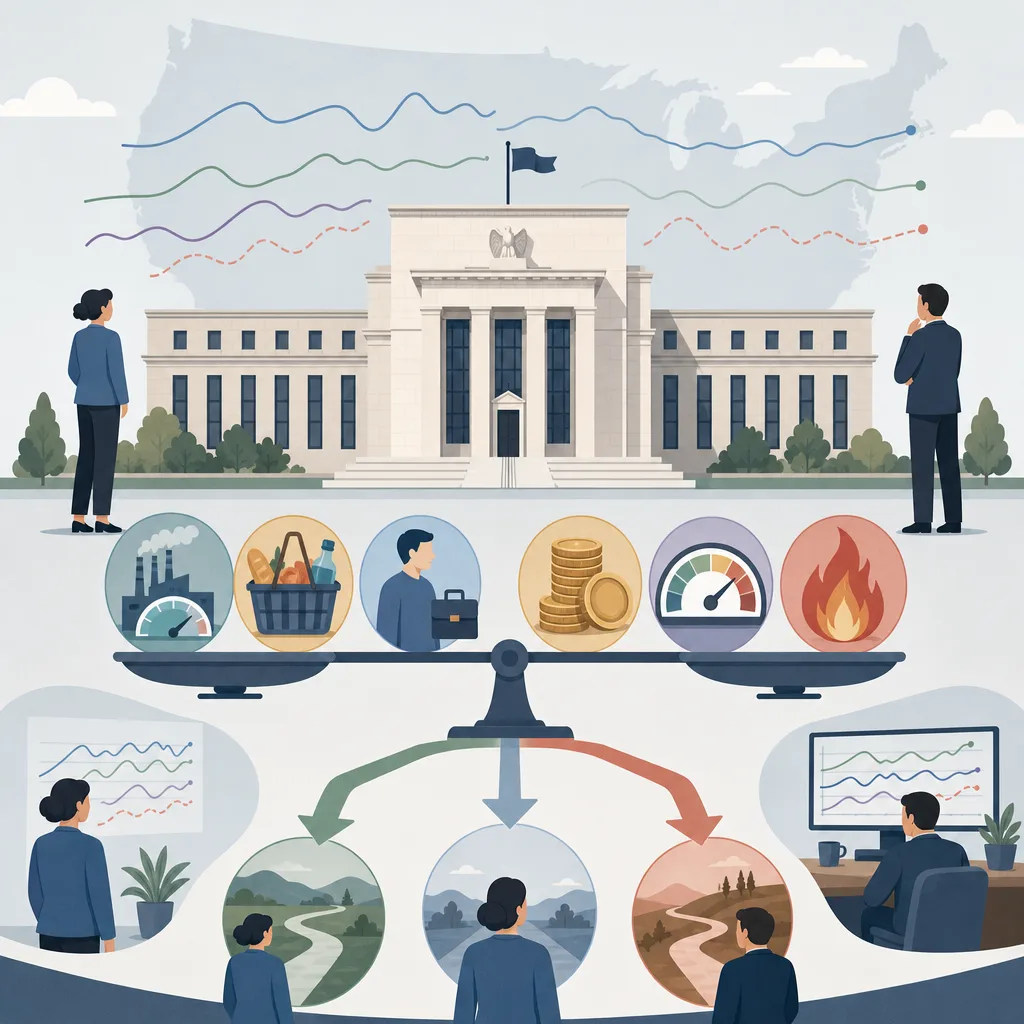
The July PPI can be interpreted as data that reduces the need for additional rate increases. However, the Federal Reserve makes policy decisions by considering the following data together.
- Headline and core PCE inflation
- Employment growth, the unemployment rate, and wage growth
- The strength of consumer and business activity
- Inflation expectations
- Financial conditions and credit risk
- Tariffs and supply-chain changes
In particular, it is necessary to determine whether month-over-month inflation remains stable for several months. Because year-over-year indicators are heavily affected by base effects, monthly trends or annualized 3-month and 6-month rates are useful when assessing near-term changes in Federal Reserve policy.
An assessment that a rate cut has become more likely should be distinguished from an actual rate-cut decision. Even if the PPI is low, the Federal Reserve may hold rates steady if employment and consumption are overheated or PCE services inflation remains high.
What to Watch in Trimmed Mean PCE and at Jackson Hole
Trimmed Mean PCE measures the underlying inflation trend by excluding a certain portion of the items with the largest monthly price changes from both ends of the distribution. It is calculated by the Dallas Fed, and its methodology differs from that of the standard core PCE, which always excludes certain categories.
A stable Trimmed Mean PCE may provide evidence that broad inflationary pressures are easing. However, the Federal Reserve cannot be assumed to change its official benchmark or decide to cut rates based on this measure alone. The Federal Reserve’s long-term inflation target is 2% based on the PCE price index, and it reviews a variety of supplementary indicators together.
At the 2026 Jackson Hole Economic Policy Symposium, the following language should be monitored.
- Whether confidence has increased that inflation is returning sustainably to the 2% target
- How strongly downside risks to the labor market are emphasized
- Whether tariff-driven inflation is viewed as temporary or persistent
- How core PCE, Trimmed Mean PCE, and housing costs are assessed
- Whether the existing view that policy is sufficiently restrictive is maintained
The full event schedule and the time of the Federal Reserve Chair’s speech should be reconfirmed through official announcements from the Kansas City Fed and the Federal Reserve. The event period and the time of the Chair’s speech are not the same concept, and the schedule may be adjusted.
Indicators and Dates to Watch Next
After the July PPI, the following data will be key to assessing whether the inflation slowdown is sustainable.
- July import price index and prices of imports from China
- July Personal Consumption Expenditures and core PCE inflation
- August CPI and PPI
- Wage growth and the unemployment rate in the employment report
- The September 15–16, 2026 meeting of the U.S. Federal Open Market Committee
If the September FOMC policy announcement is made at 2:00 p.m. U.S. Eastern Daylight Time, it will be 3:00 a.m. the following day in Korea. The exact release time should be confirmed on the Federal Reserve’s official calendar.
Three Misconceptions Investors Should Avoid
Slower Growth Is Not Deflation
A year-over-year rate of 4.7% does not mean that prices fell; it means that they remain higher than a year earlier. Disinflation should be distinguished from a decline in the price level.
A Below-Expected Reading Does Not Guarantee a Rate Cut
A reading below market expectations may change policy expectations, but the Federal Reserve reviews several months of inflation and employment data.
A Low PPI Is Not Good News for Every Business
If selling-price growth slows faster than input-cost growth, corporate profit margins may decline. Conversely, margins may improve if costs fall faster, so industry-specific costs and pricing power should be considered together.
Conclusion
The July 2026 U.S. PPI showed that inflationary pressure at the producer level eased from the previous period. A flat month-over-month headline reading and slower core growth are factors that reduce concerns about additional Federal Reserve tightening.
However, the lag from the PPI to the CPI is not constant, and Chinese imports are not directly included in the U.S. PPI. To assess the future path of interest rates, PCE inflation, employment, import prices, services inflation, and the next FOMC message should all be reviewed together.
FAQ
Does the U.S. July 2026 PPI of 4.7% mean that prices fell?
No. A 4.7% year-over-year increase means that producer prices were 4.7% higher than a year earlier. A lower rate than the previous increase does not mean that prices fell; it means that the pace of price increases slowed.
Does a 0.0% month-over-month PPI mean that all producer prices remained unchanged?
No. It means that increases and decreases across individual items offset each other, leaving the overall seasonally adjusted index unchanged on a rounded basis. Subcategories such as goods, services, and energy may move differently from one another.
What does core PPI exclude?
It generally refers to PPI excluding food and energy, but U.S. releases also include a separate measure that excludes food, energy, and trade services. When comparing figures, you should check exactly what is excluded.
If PPI falls, does CPI necessarily fall 2–3 months later?
No. PPI and CPI cover different items and use different weights, and they also treat housing costs, imports, and distribution margins differently. The speed at which changes in production costs are passed through to consumer prices also varies depending on the industry and companies' pricing power.
Does an increase in imports from China directly lower the U.S. PPI?
The U.S. PPI measures the prices received by domestic producers, so import prices are not directly included. However, indirect channels are possible, such as inexpensive imported intermediate goods lowering costs for U.S. companies or affecting competition and distribution margins.
Does a lower-than-expected PPI mean that the Federal Reserve will cut interest rates?
It may be data that increases the likelihood of an interest rate cut, but it does not guarantee a decision. The Federal Reserve evaluates PCE inflation, employment, wages, consumption, inflation expectations, and financial conditions together.
Why might Treasury yields and the dollar fall after the PPI release?
Because if inflation is weaker than expected, the market may lower its outlook for future policy rates. However, actual price movements are also affected by other economic indicators, Treasury supply and demand, geopolitical events, and existing market positions.
How does trimmed mean PCE differ from core PCE?
Core PCE always excludes food and energy, whereas trimmed mean PCE statistically excludes items with extreme price movements each month. Both indicators are used as supplementary measures for assessing underlying inflation trends.
Sources
- U.S. Bureau of Labor Statistics Producer Price Index News Release
- U.S. Bureau of Labor Statistics Producer Price Indexes
- BLS Handbook of Methods: Producer Price Index
- Federal Reserve FOMC Calendars and Information
- Federal Reserve Statement on Longer-Run Goals and Monetary Policy Strategy
- Federal Reserve Bank of Dallas Trimmed Mean PCE Inflation Rate
- CME FedWatch Tool
Images