Skip to content
Binder

Investing: Smart Asset Management and Investment Strategies for the Future

Investing is less about winning big than about losing less and staying in long enough for it to count. Here we walk from opening a first account through allocation and risk management, laying out the reasoning behind each decision.

We cover what to look at asset by asset: stocks and ETFs, funds and bonds, retirement accounts, property, gold and commodities, and cryptocurrencies. We also trace how interest rates and exchange rates reach prices, how dividends and ex-rights dates are set, and what diversification, rebalancing and holding steady through a drawdown actually require.

Rather than promising returns, we show our reasoning. For beginners that means the terms and the steps; for those already invested, a standard to test their own positions against.

84 posts

No infographics are available in the current language, so infographics in all languages are shown.
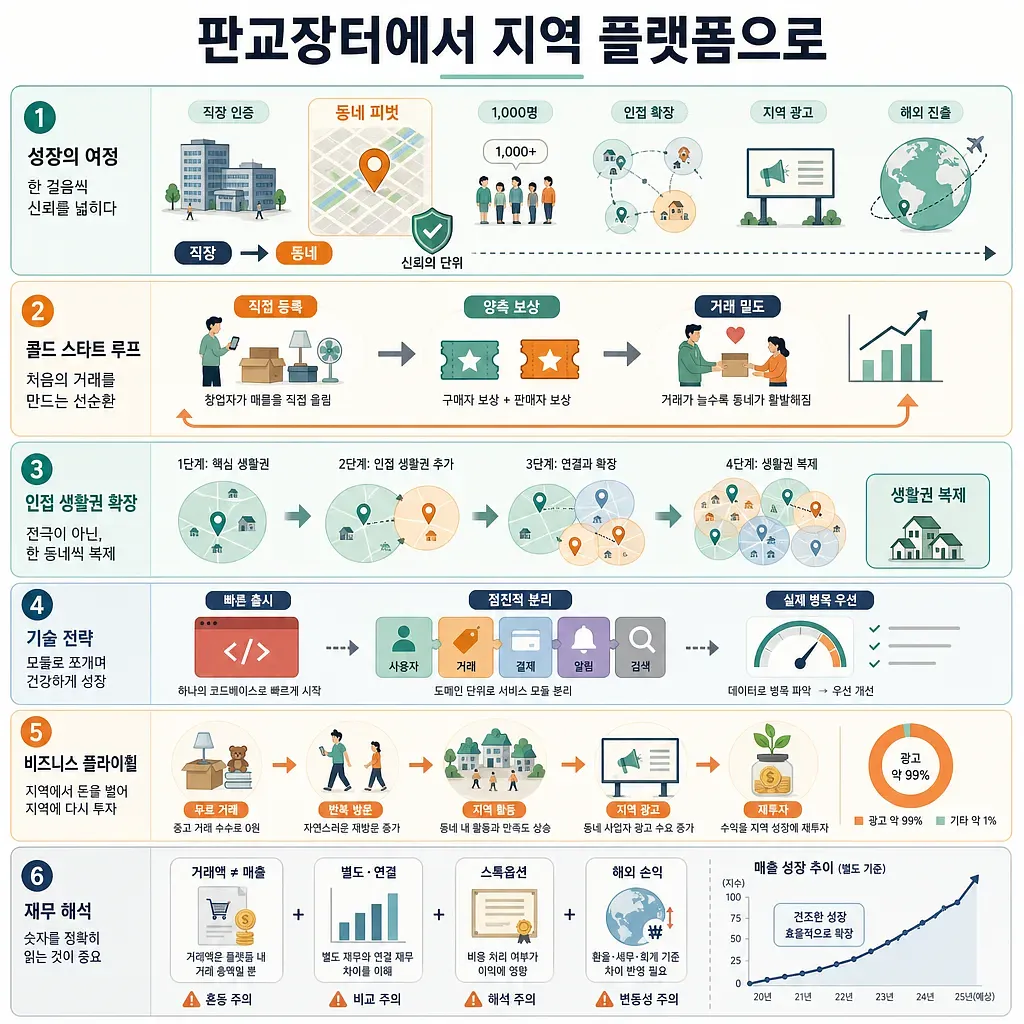
The graphic outlines Daangn’s path through trust, expansion, technology, advertising, and financial analysis. How Karrot Grew from Pangyo Market into a Massive Local Platform
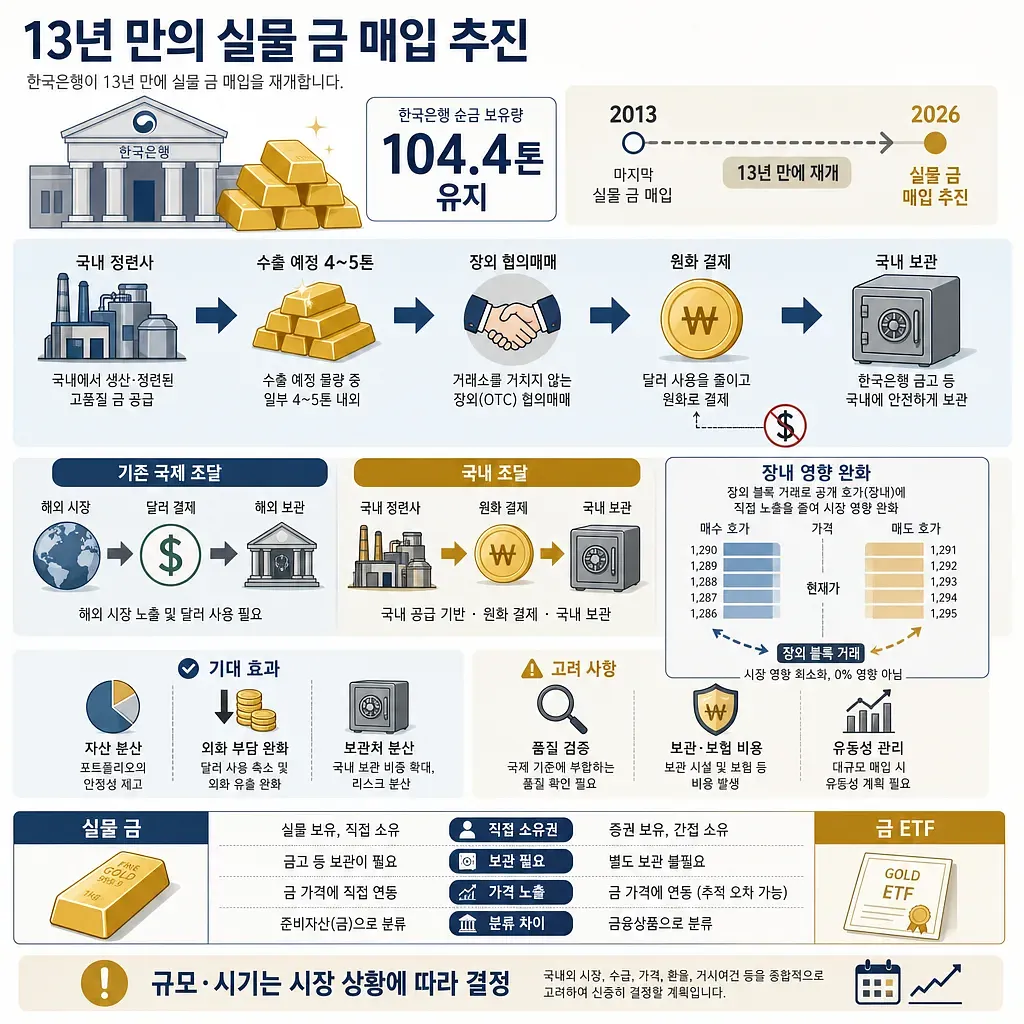
The plan sources gold from domestic refiners, settles in won, and stores it in South Korea. The Bank of Korea's First Physical Gold Purchase Plan in 13 Years and Domestic Procurement Method
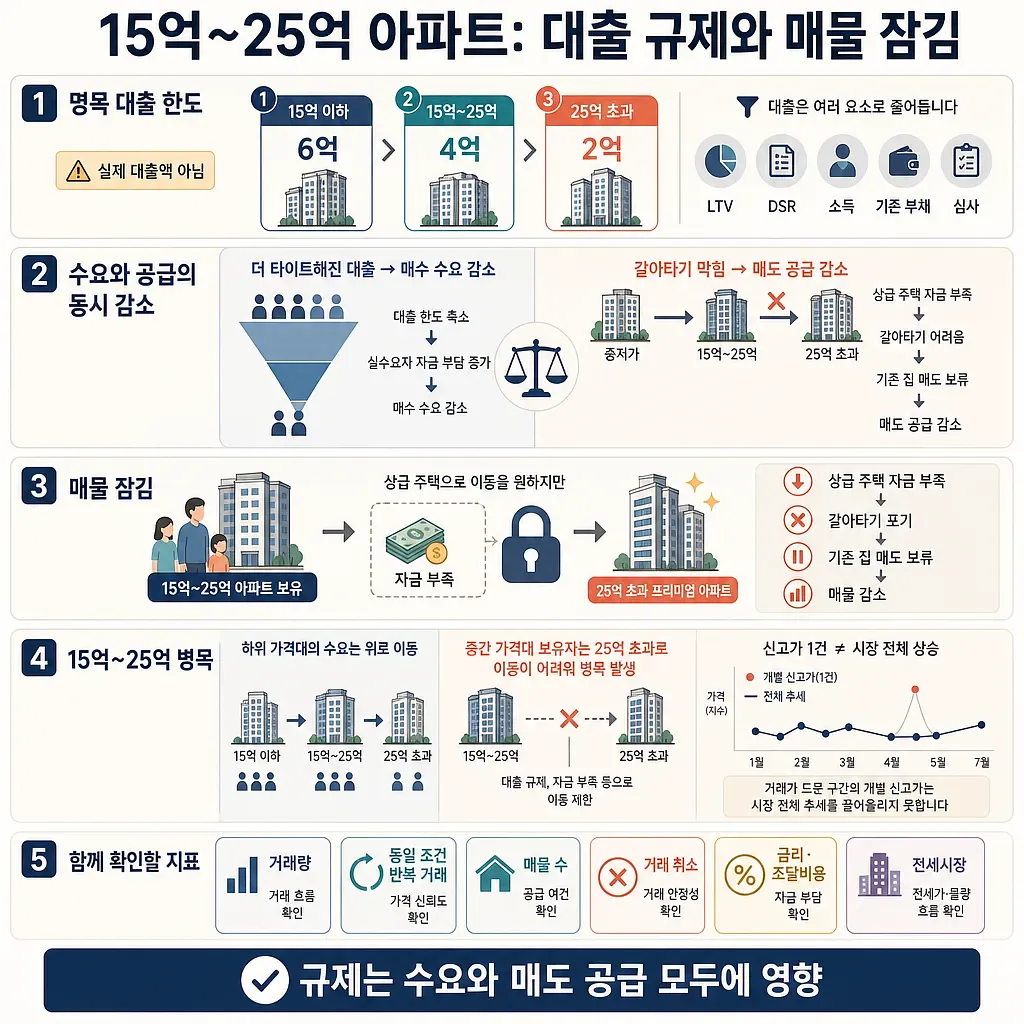
It shows how tighter lending reduces buyer demand and move-up listings, creating a bottleneck in the mid-price market. Loan Regulations and Listing Lock-In in the KRW 1.5–2.5 Billion Apartment Market
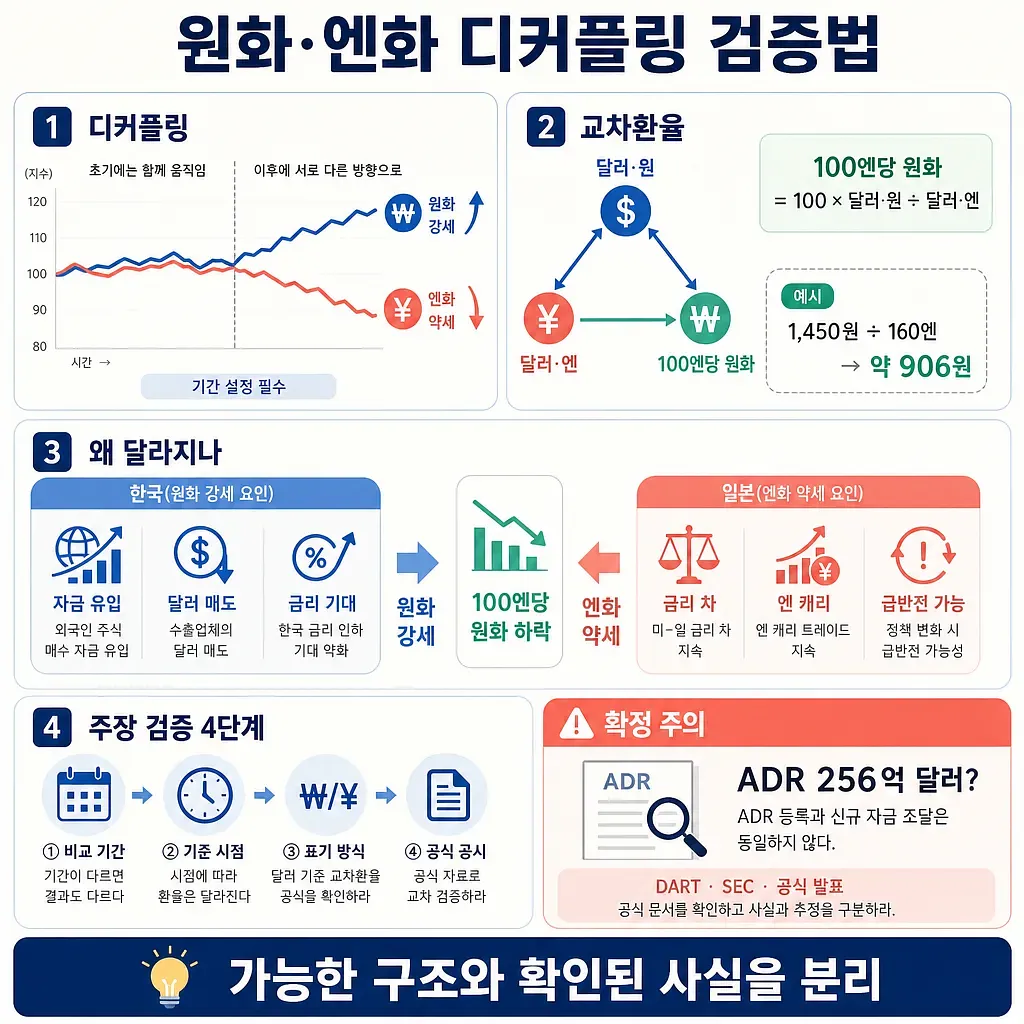
The graphic explains won strength and yen weakness while outlining how to verify exchange-rate claims. The Structure of Won–Yen Decoupling and How to Verify Exchange Rate Claims
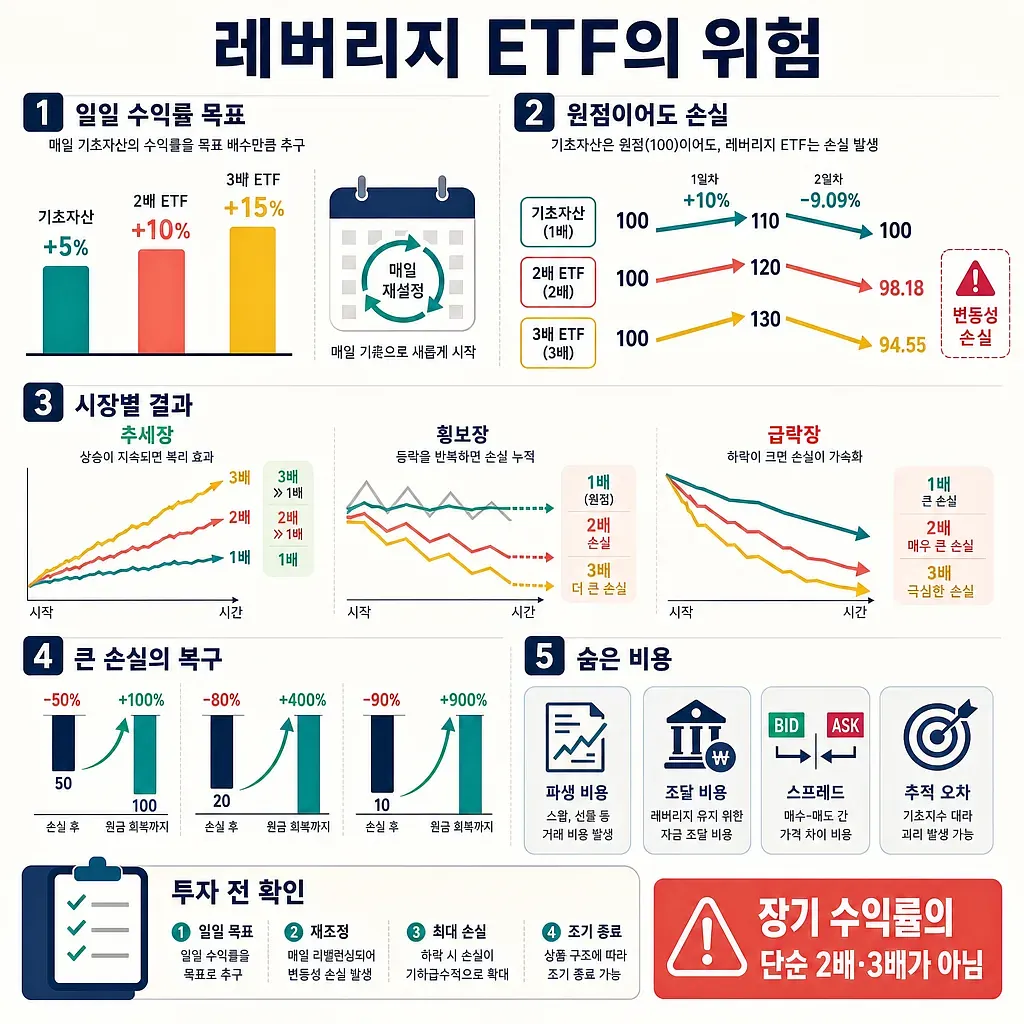
The charts explain why long-term leveraged ETF returns are not simply two or three times the index return. Why Leveraged ETFs Are Risky: Daily Returns and Volatility Drag
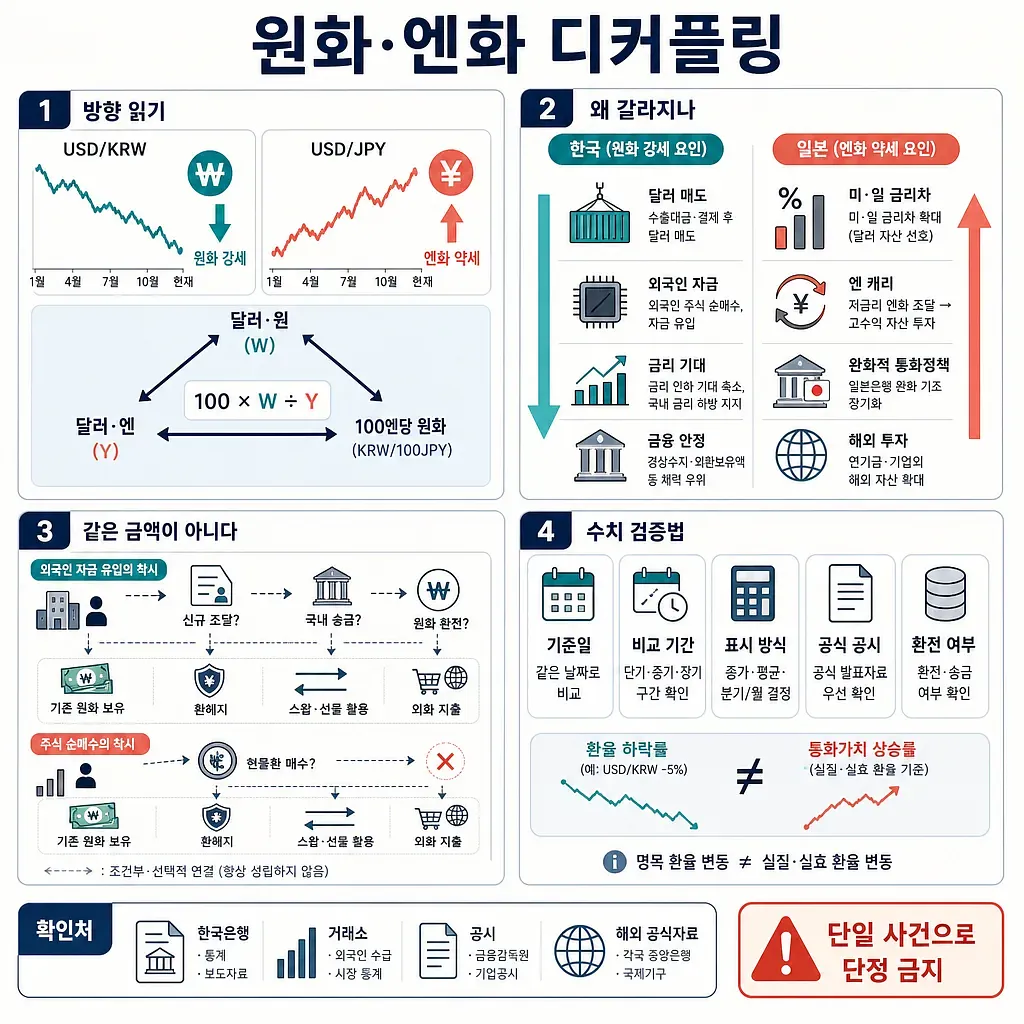
The graphic explains diverging won and yen trends, possible drivers, capital flows, and verification criteria. Why the Won and Yen Decouple: Causes and How to Verify the Figures
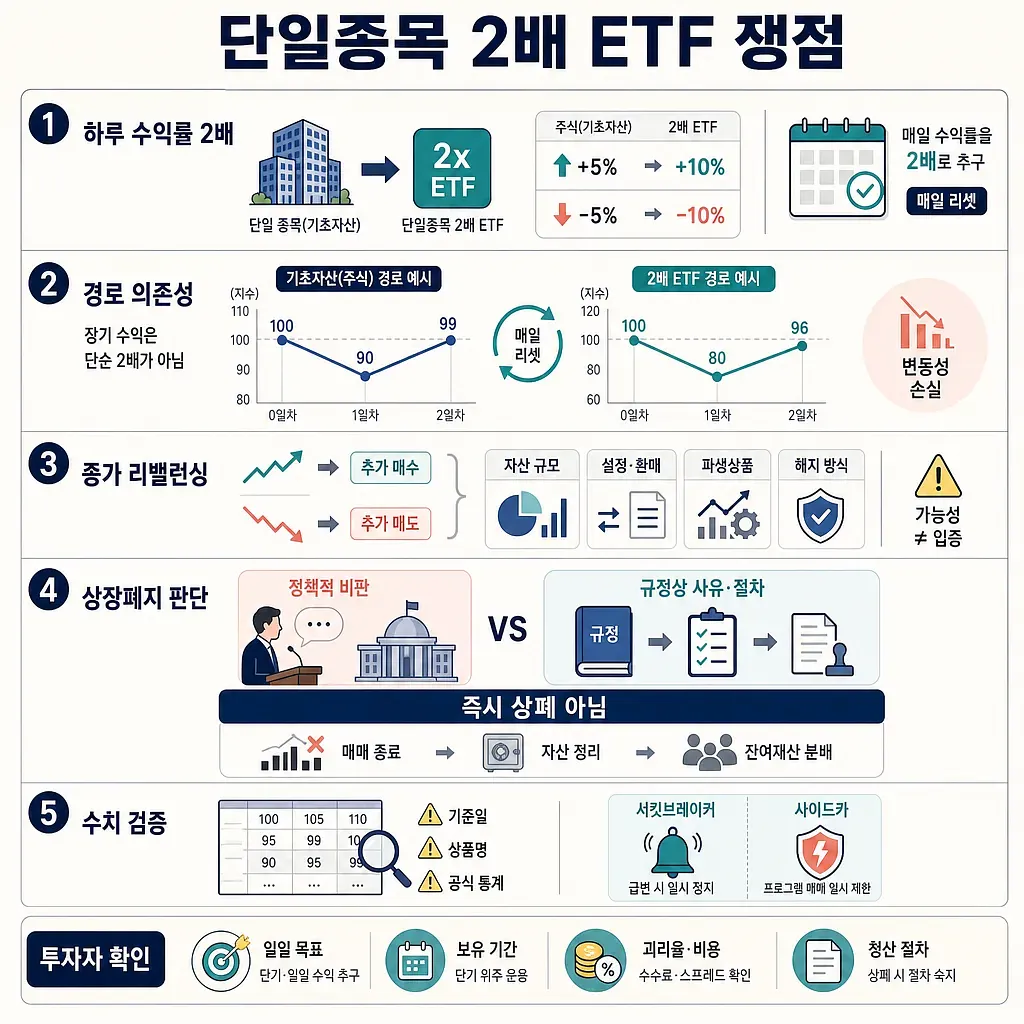
The graphic outlines five key issues in evaluating single-stock 2x ETFs and potential delisting. The Structure and Issues Behind Calls to Delist Single-Stock Leveraged ETFs
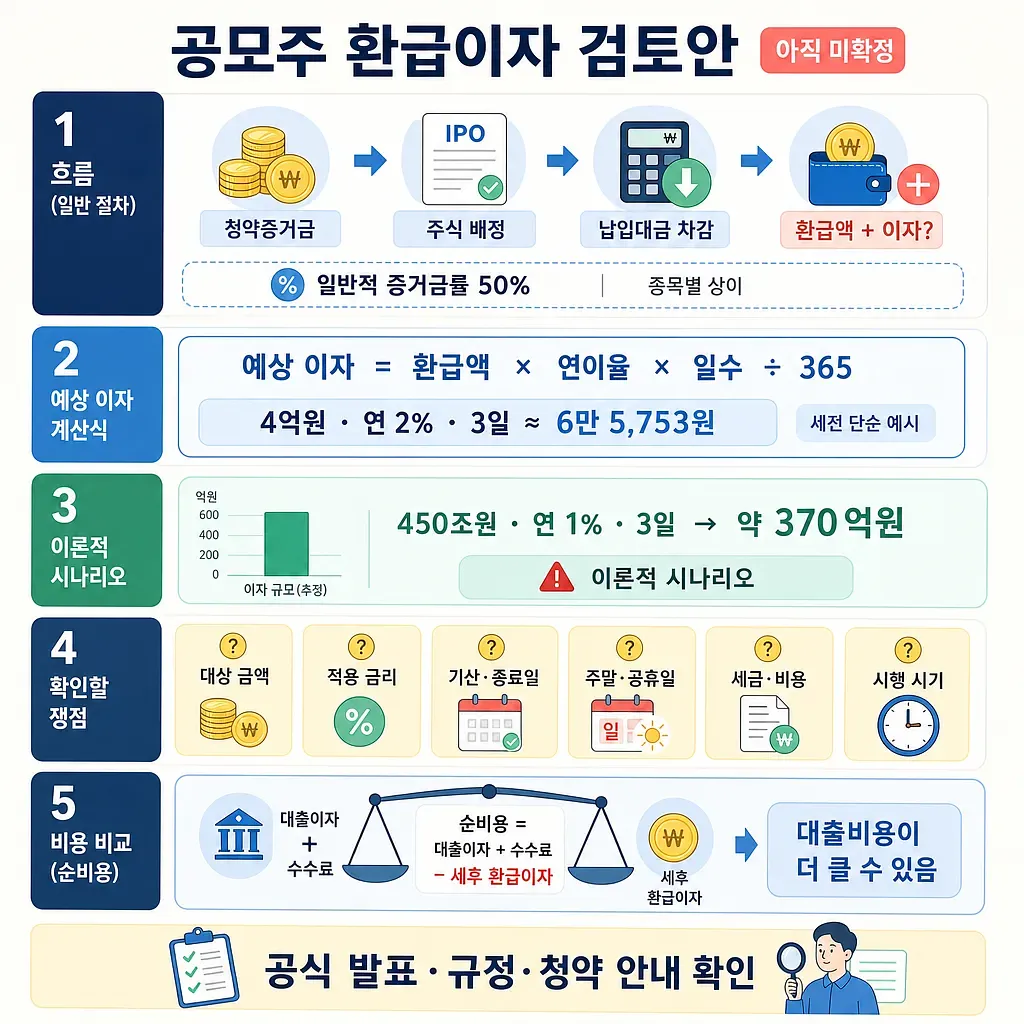
The graphic explains the proposed, unconfirmed refund interest and how to estimate it. Proposal for Interest on Refunded IPO Subscription Deposits: Calculation and Issues to Review
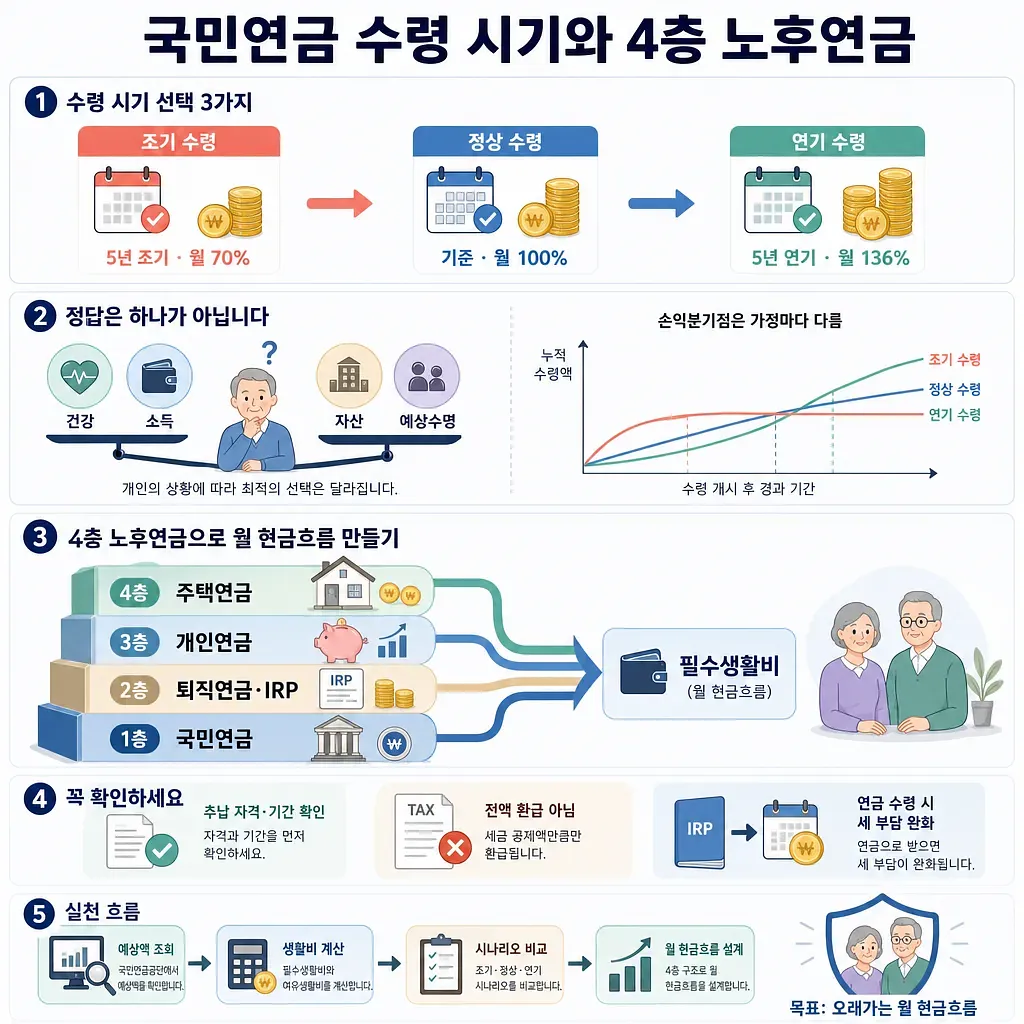
The infographic compares early, standard, and deferred benefits and shows a four-layer retirement income plan. When to Claim the National Pension and How to Build a Four-Tier Retirement Pension Plan
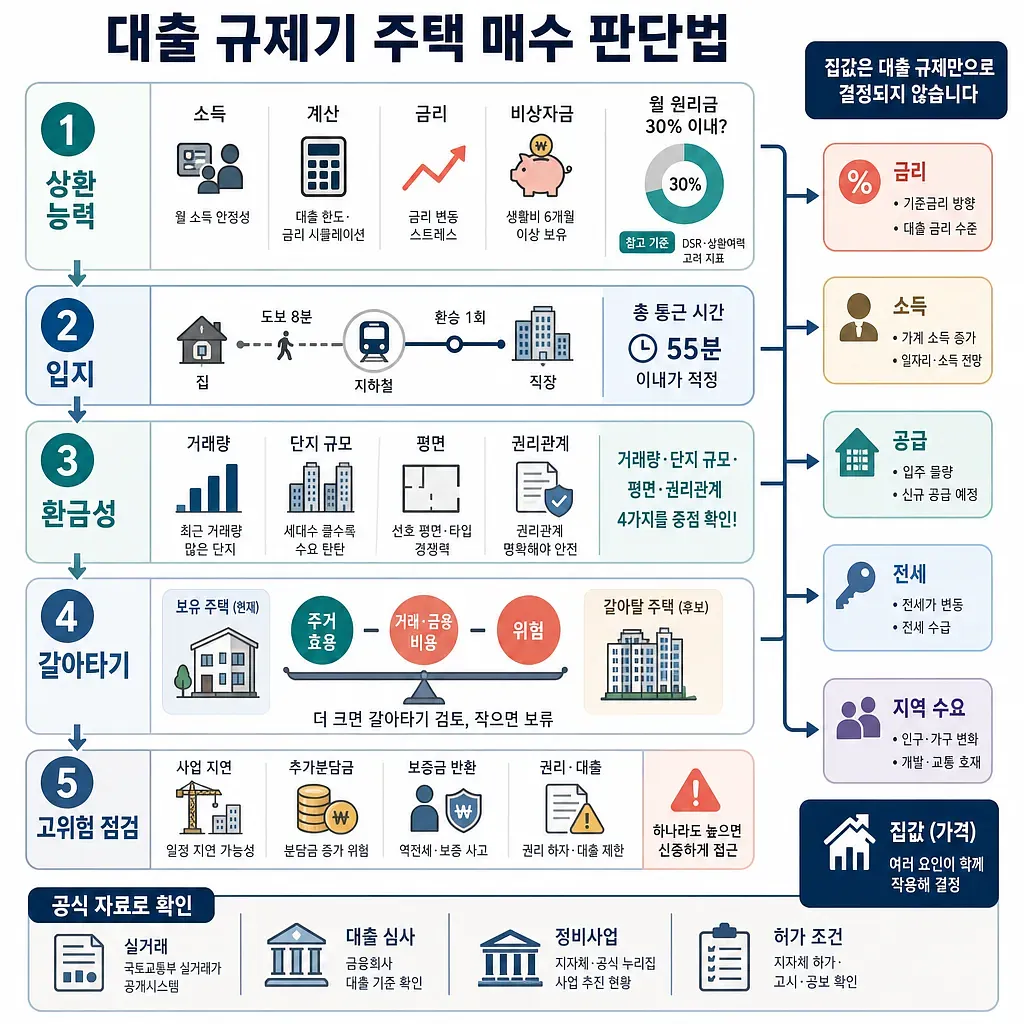
The guide weighs finances, location, liquidity, upgrading, and risks alongside key housing market indicators. How to Decide Whether to Buy a Home During Loan Restrictions: Repayment Capacity, Location, and Liquidity
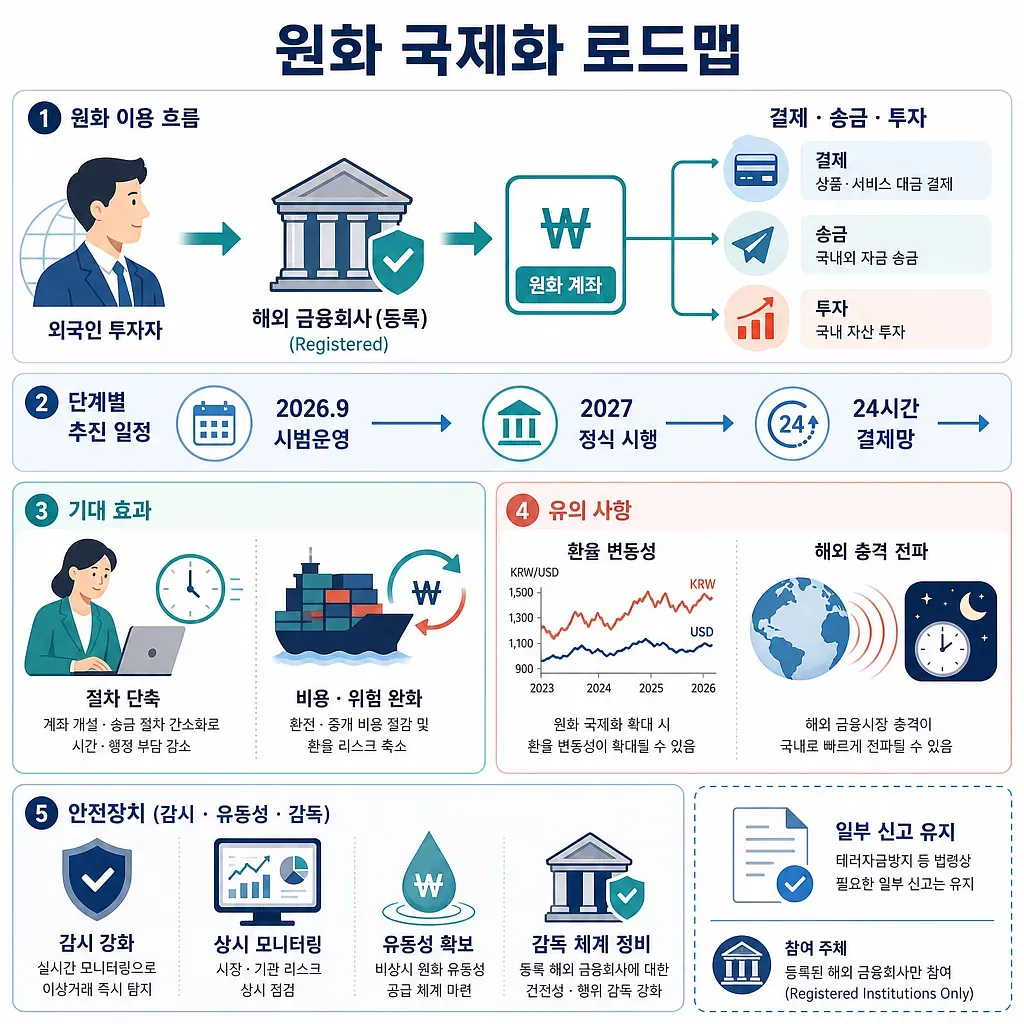
The infographic outlines the phased rollout of won internationalization and its expected impacts. Key Points and Expected Impact of the Won Internationalization Roadmap
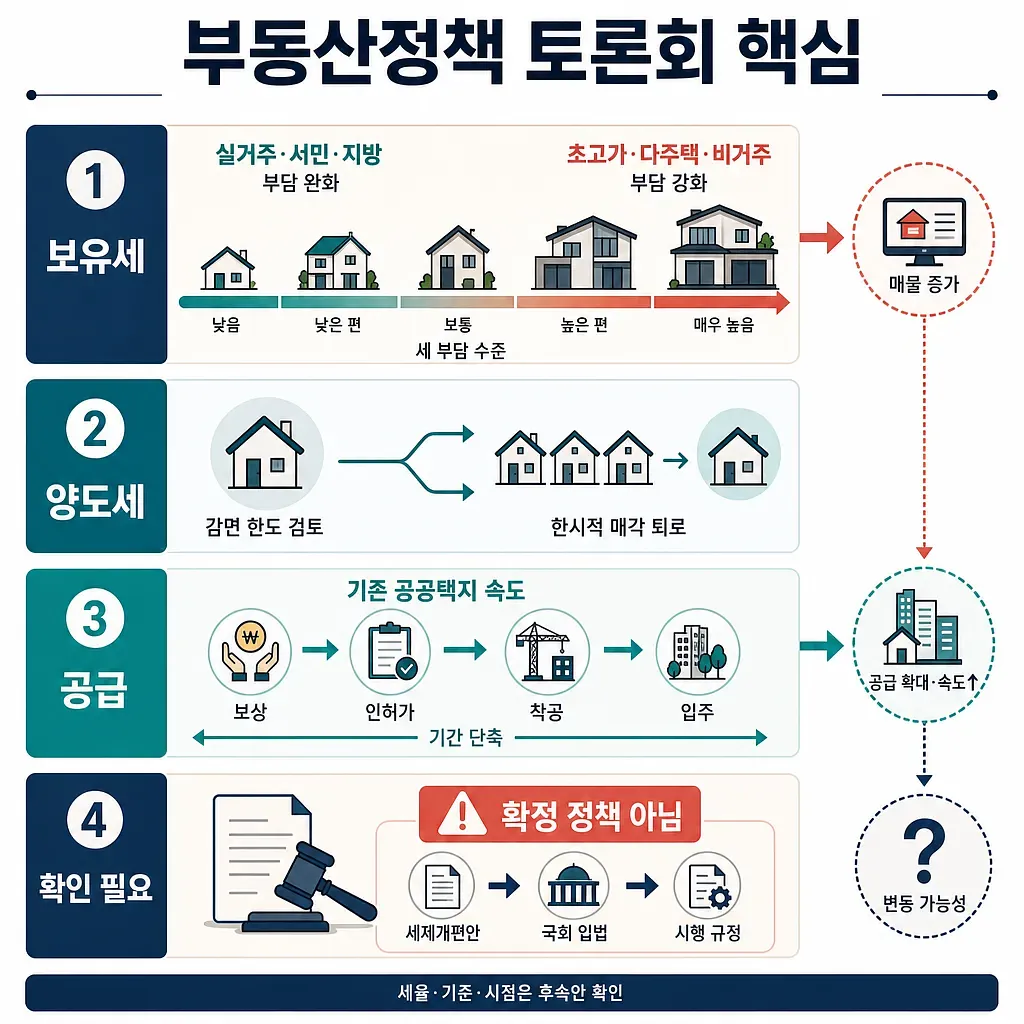
The graphic outlines tax relief, a temporary path to sell, faster public housing supply, and the policy approval process. Key Takeaways from the National Real Estate Policy Debate: Holding Tax, Capital Gains Tax, and Supply
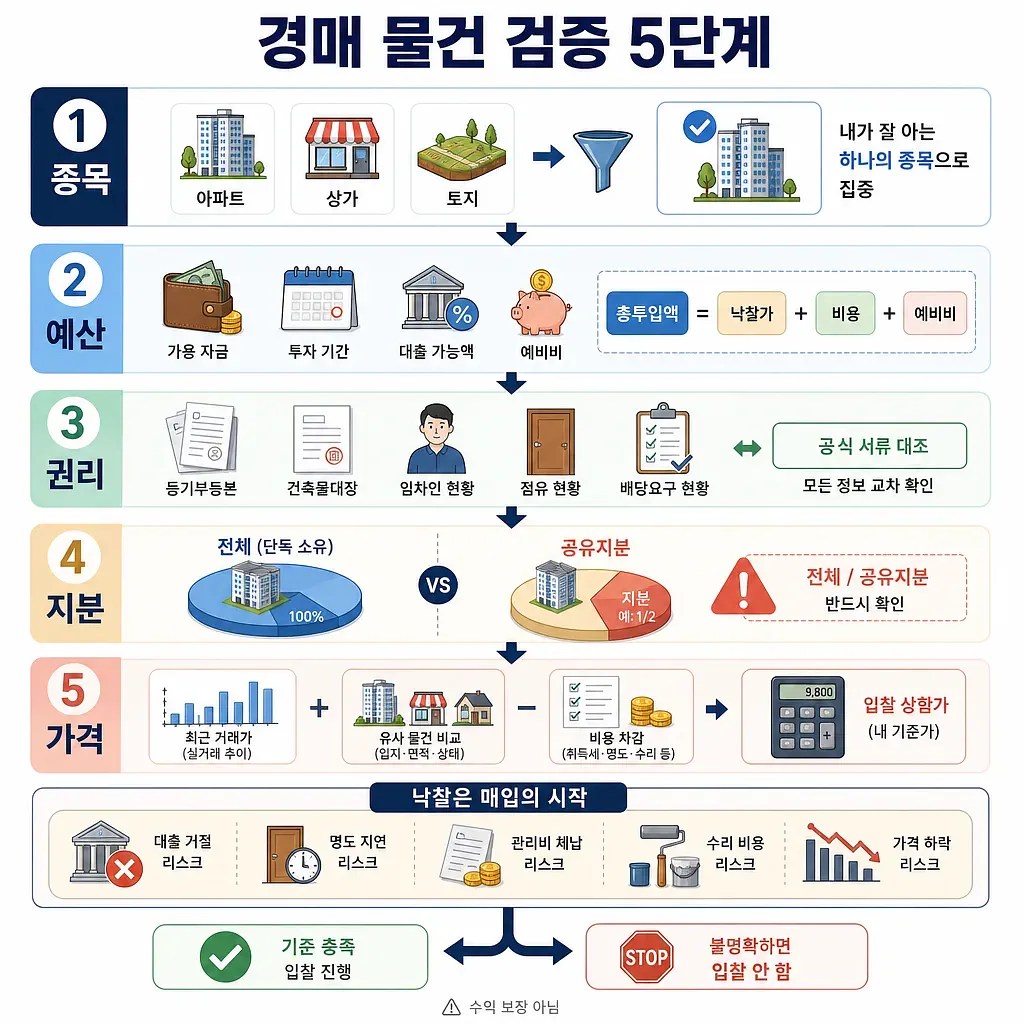
The infographic shows how beginners can verify an auction property before deciding whether to bid. A 5-Step Method for Beginners to Find and Verify Real Estate Auction Properties
The infographic outlines how the PBR 0.8 rule uses share prices and net assets, along with its caveats and remedies. Structure of the Anti-Stock-Price Suppression Law and the PBR 0.8x Issue
It highlights principles over prediction, allocation, rebalancing, risk control, and mental discipline. Investment Principles and Mental Management Strategies to Follow in a Volatile Market
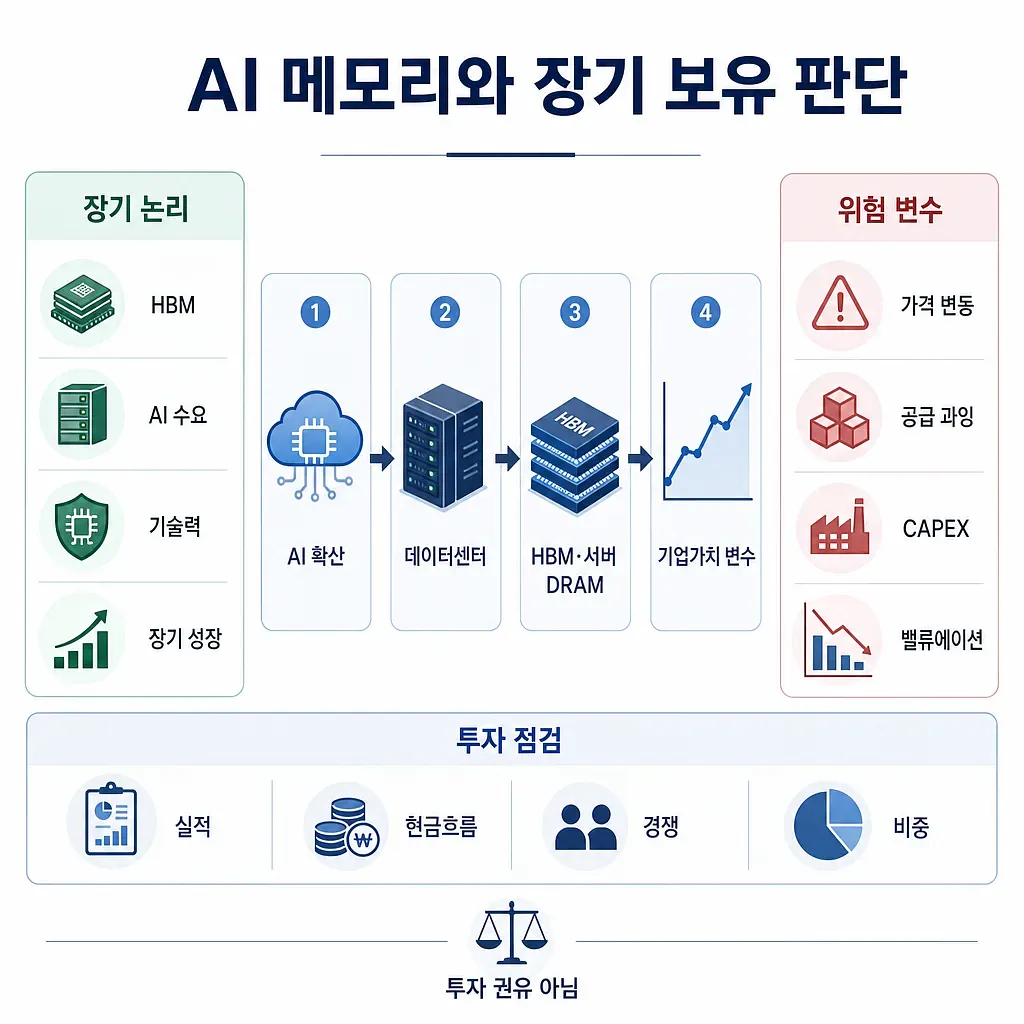
The graphic summarizes HBM demand, AI growth, risks, and investment checks. Chairman Choi Tae-won’s View on Long-Term Holding of SK Hynix: The Key to AI Memory Demand and Investment Decisions
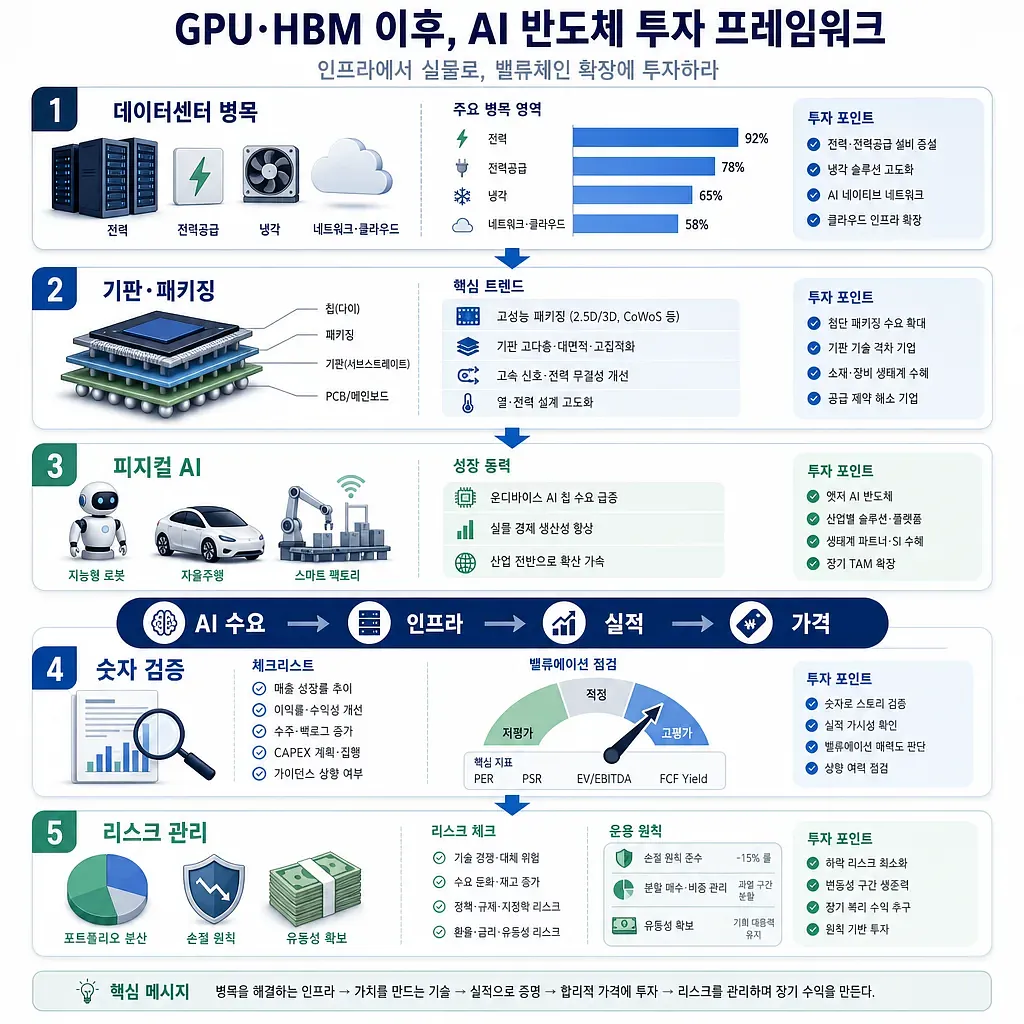
The chart frames post-GPU and HBM investing around bottleneck infrastructure, earnings, valuation, and risk control. The Investment Framework Beyond AI Semiconductors: How to View Data Centers, Circuit Boards, and Physical AI
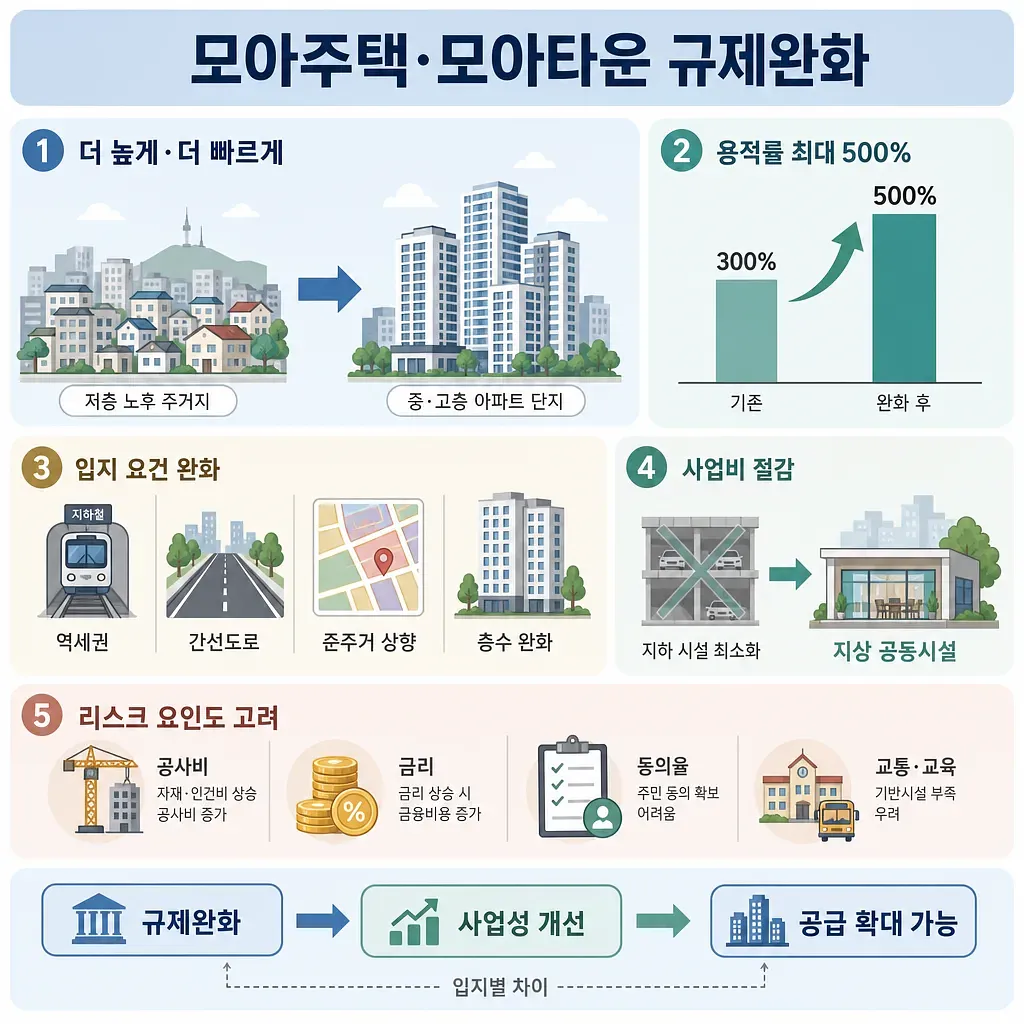
The graphic summarizes how Seoul’s relaxed Moa housing rules could change feasibility and supply. Deregulation of Seoul’s “Moah Housing” and “Moah Town” Projects: A Floor Area Ratio of 500% and Changes in Project Viability
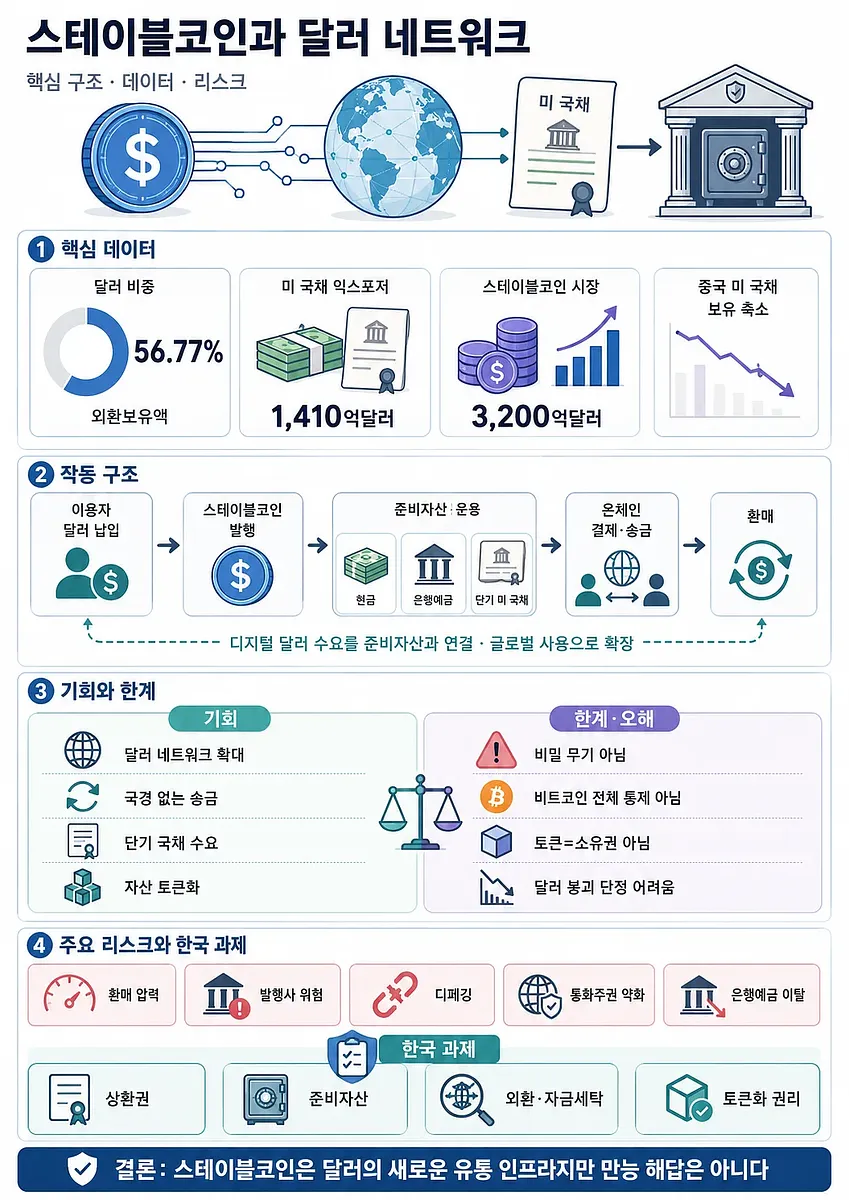
The infographic explains stablecoin reserves, Treasury demand, redemption risks, regulation, and policy priorities. Can Stablecoins Extend the Dollar’s Hegemony?: Demand for U.S. Treasuries and the Reality of On-Chain Finance
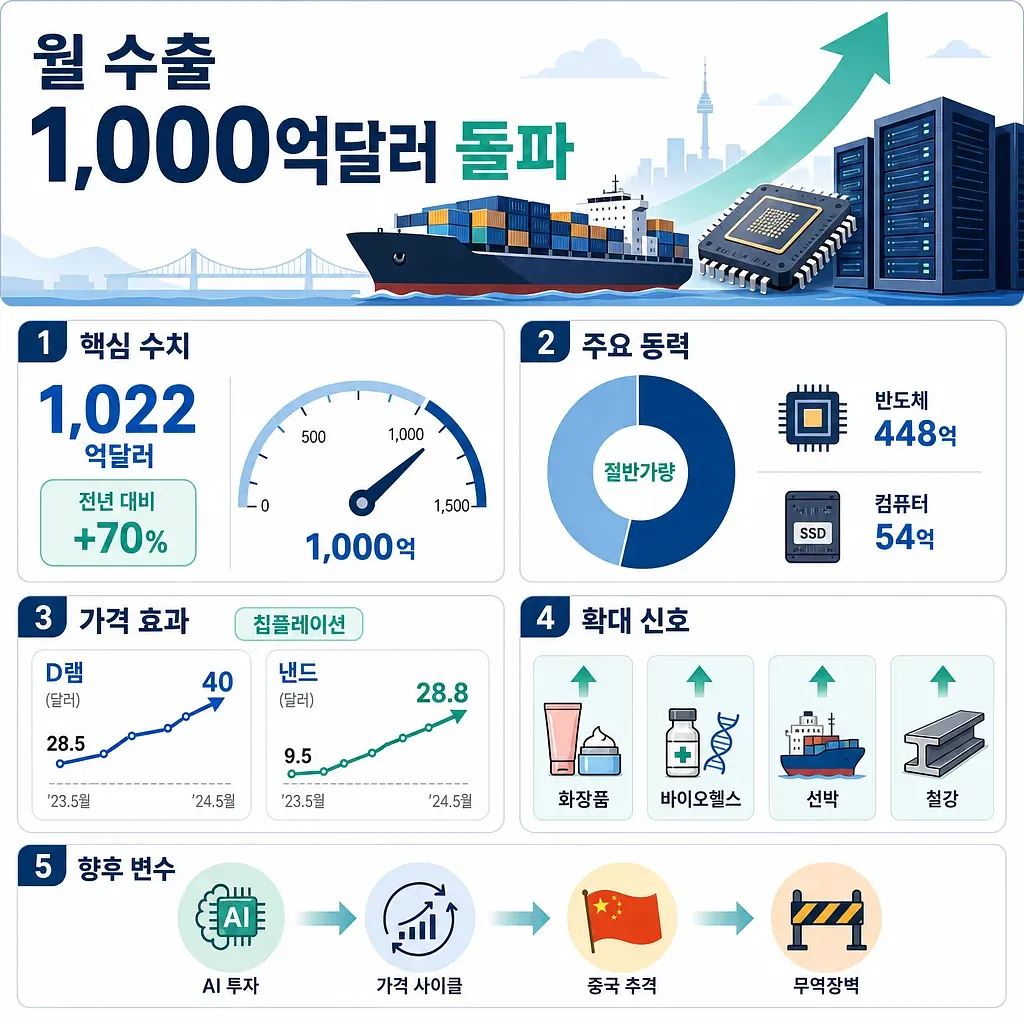
Ships, semiconductors, servers, and a rising arrow illustrate Korea’s monthly export milestone. The Significance and Key Drivers Behind South Korea’s Monthly Exports Surpassing $100 Billion
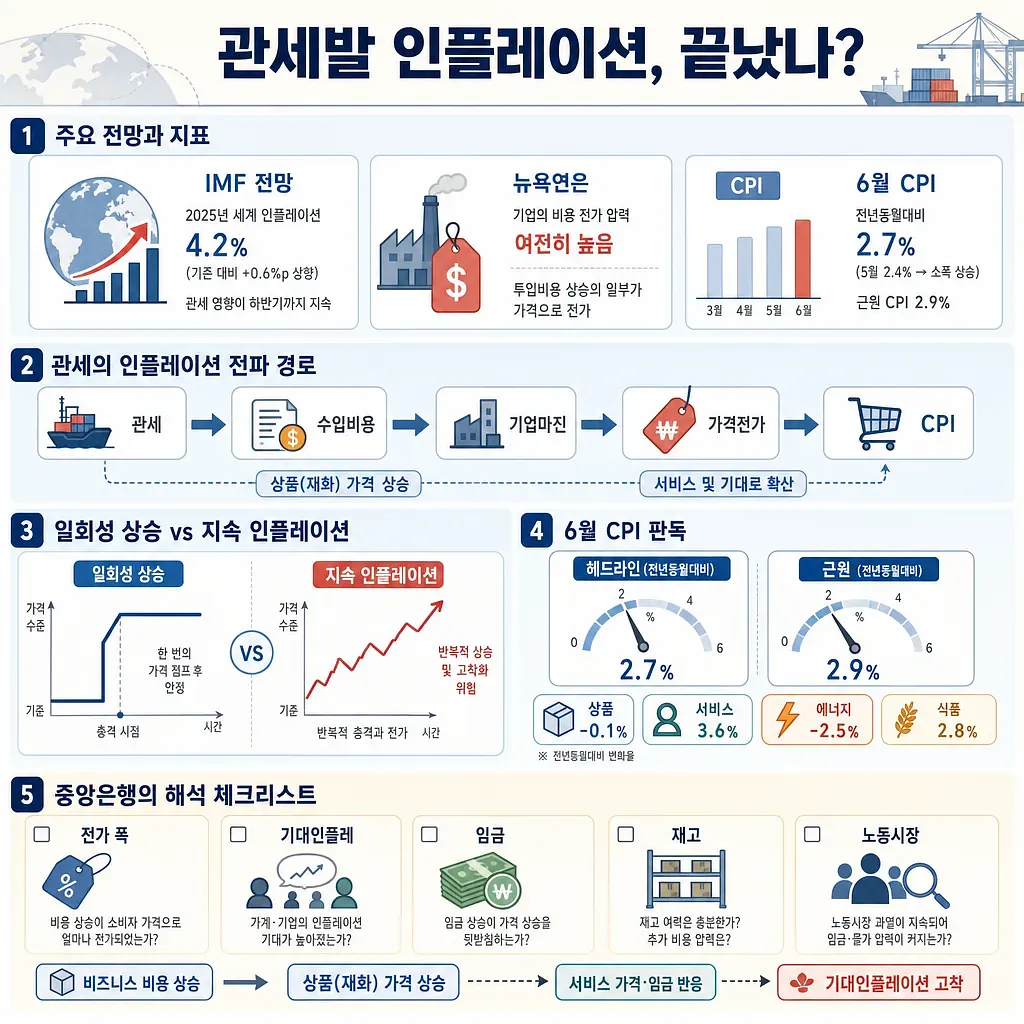
The graphic summarizes IMF forecasts, New York Fed findings, June CPI data, and how tariffs may pass into prices. Is Tariff-Driven Inflation Over? How to Interpret the IMF Forecast, the New York Fed Survey, and June’s CPI Together
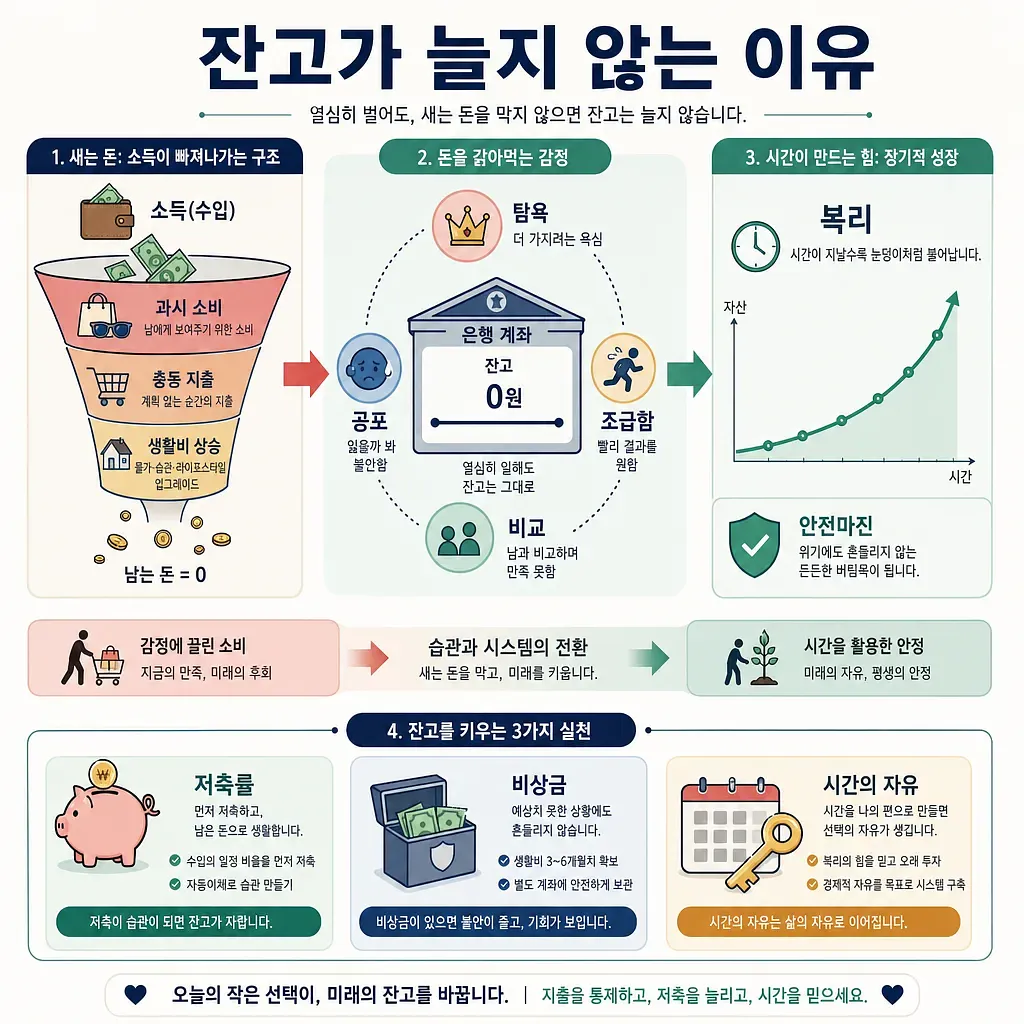
The graphic shows how income leaks away and how habits, savings, and time can build financial stability. Why Your Bank Balance Doesn't Grow Even When You Work Hard: The Relationship Between Money and Psychology
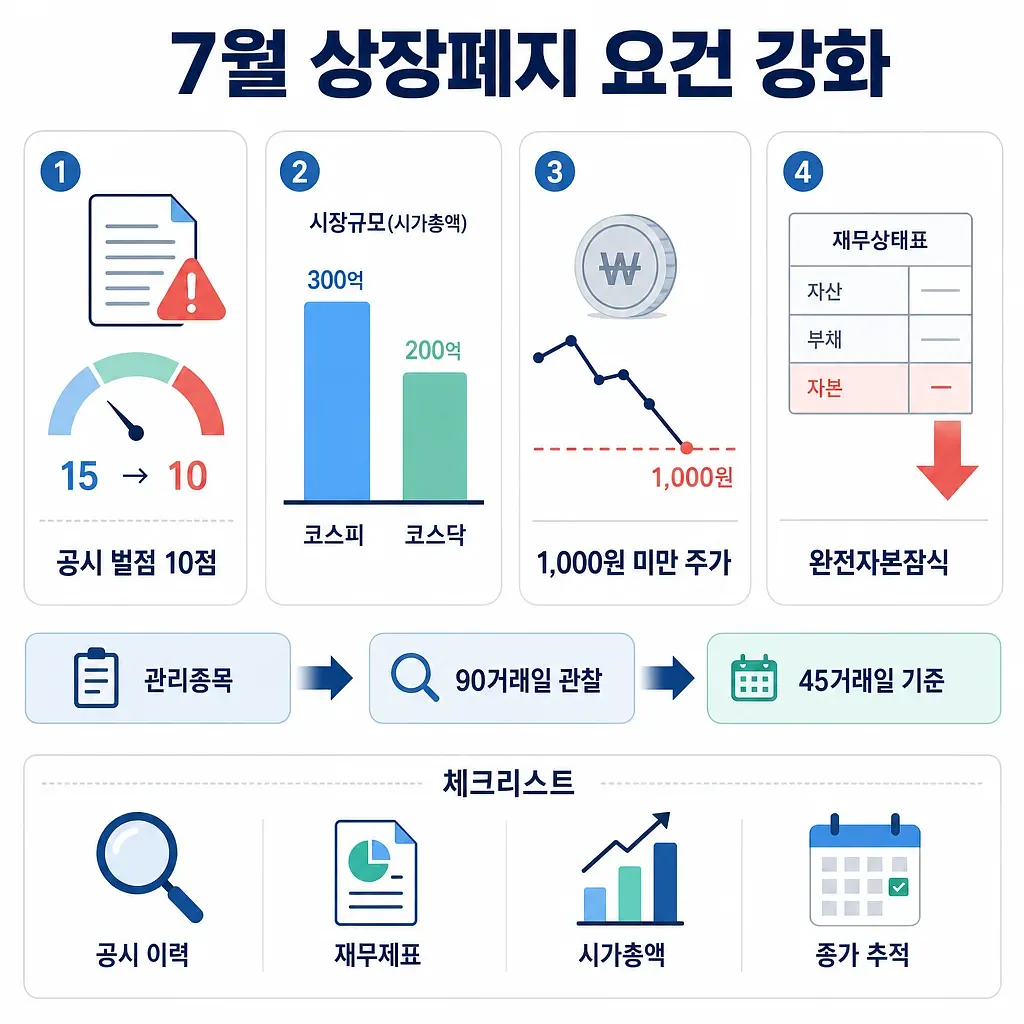
The graphic outlines tougher delisting criteria such as disclosure penalties, market cap, share price, and capital impairment. Summary of the KOSPI and KOSDAQ Delisting Requirements Taking Effect in July
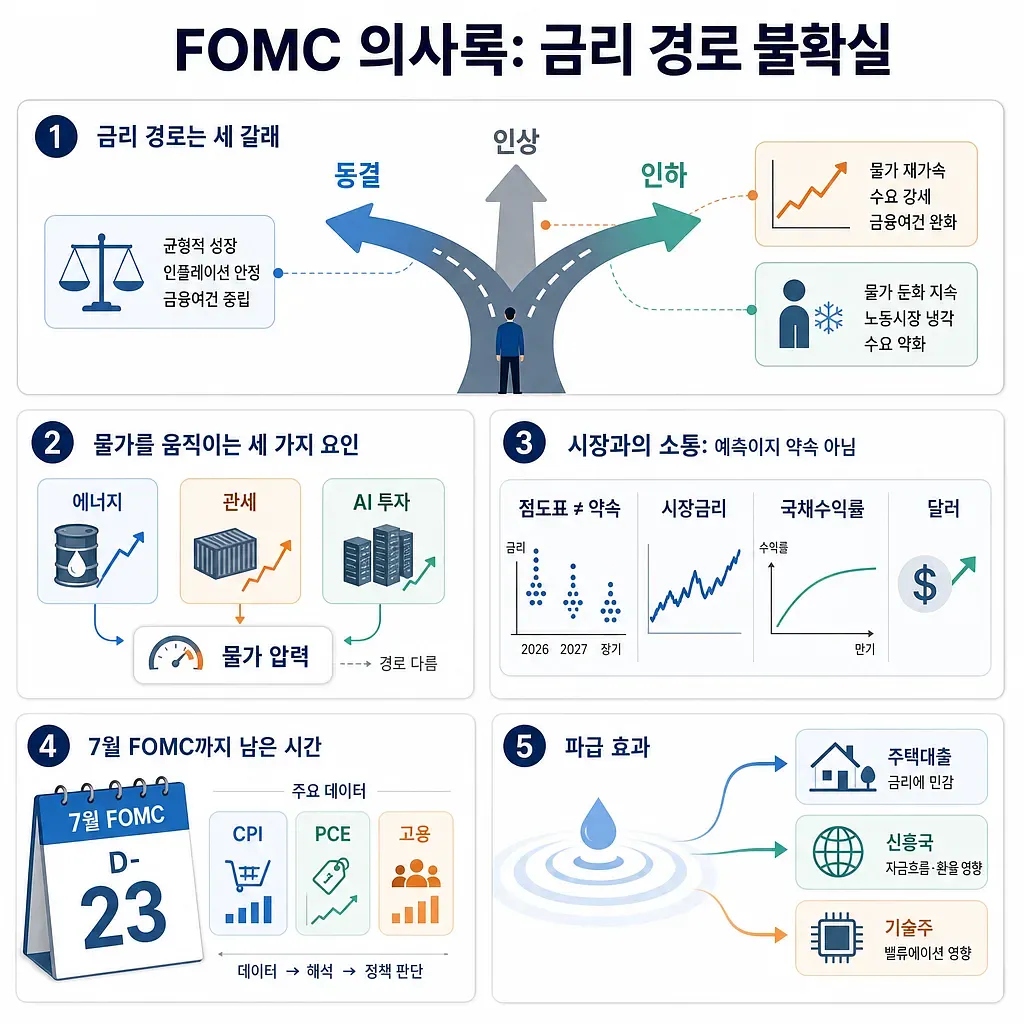
The infographic summarizes possible Fed rate paths, inflation drivers, market signals, and spillover effects. Reading the First FOMC Minutes Under Chair Wash: Why the U.S. Interest Rate Path Has Become Uncertain Again