Skip to content
Binder

Investing: Smart Asset Management and Investment Strategies for the Future

Investing is less about winning big than about losing less and staying in long enough for it to count. Here we walk from opening a first account through allocation and risk management, laying out the reasoning behind each decision.

We cover what to look at asset by asset: stocks and ETFs, funds and bonds, retirement accounts, property, gold and commodities, and cryptocurrencies. We also trace how interest rates and exchange rates reach prices, how dividends and ex-rights dates are set, and what diversification, rebalancing and holding steady through a drawdown actually require.

Rather than promising returns, we show our reasoning. For beginners that means the terms and the steps; for those already invested, a standard to test their own positions against.

84 posts

No infographics are available in the current language, so infographics in all languages are shown.
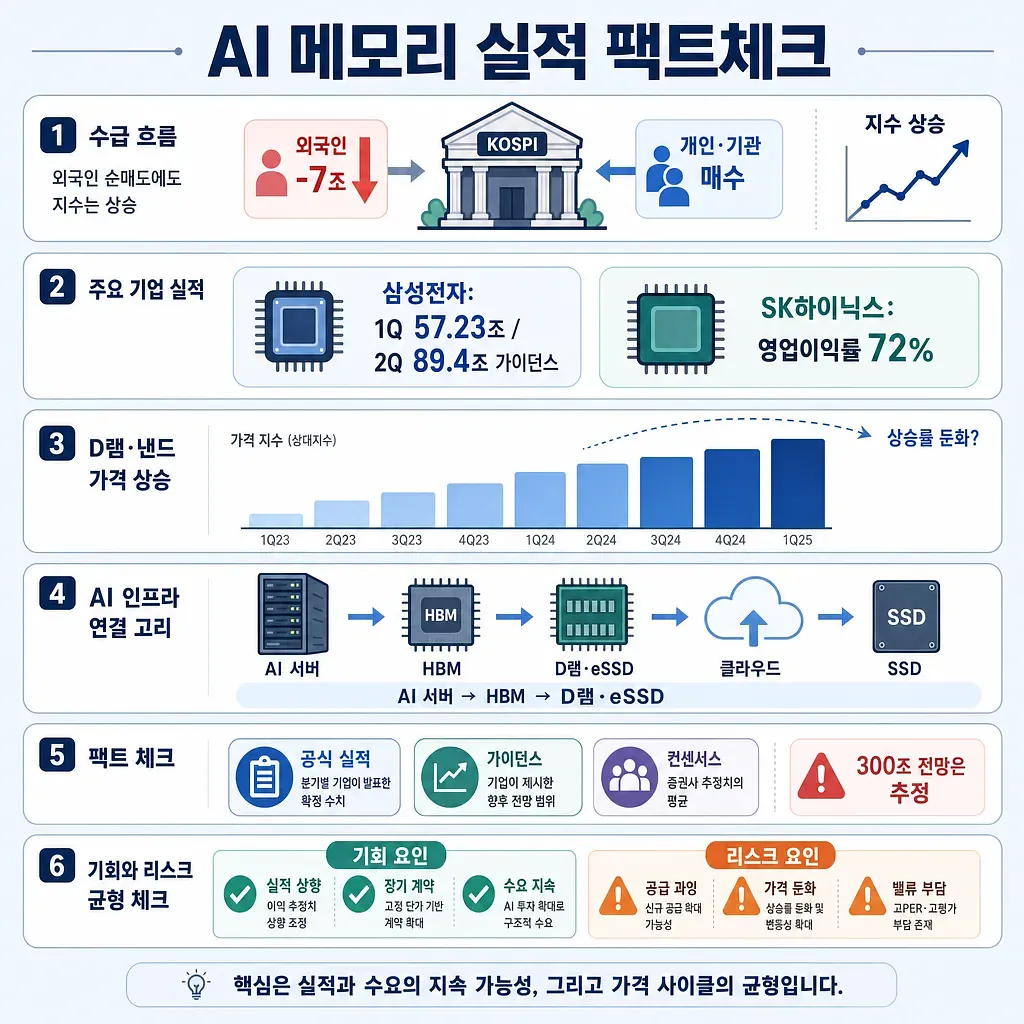
The graphic summarizes KOSPI flows, Samsung and SK Hynix results, memory prices, and AI demand links. Foreign Investors Sell 7 Trillion Won Worth of Samsung Electronics and SK Hynix Shares; Fact-Check on AI Memory Earnings
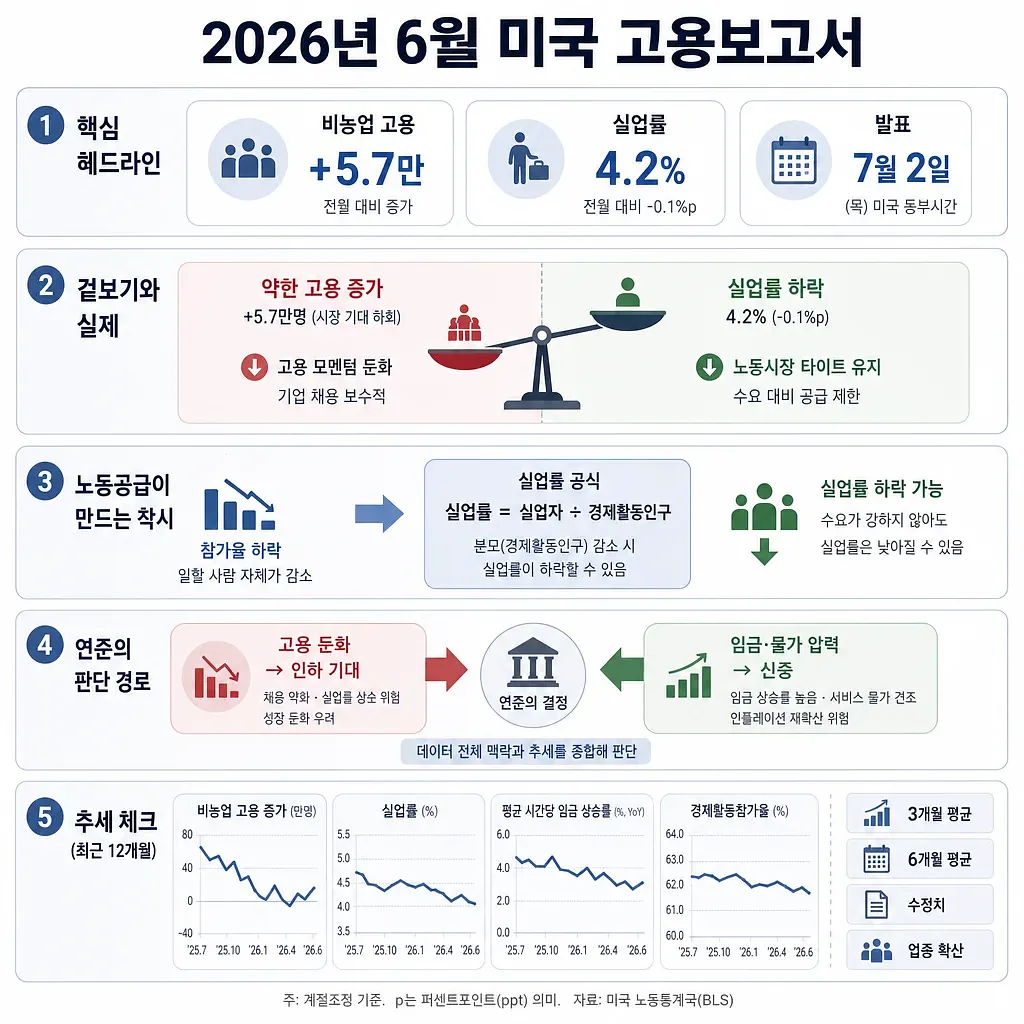
The graphic highlights 57,000 payroll gains, a 4.2% unemployment rate, and slowing labor supply. Analysis of the U.S. June 2026 Employment Report: Labor Supply Slowdown Behind the Decline in the Unemployment Rate and Interest Rate Outlook
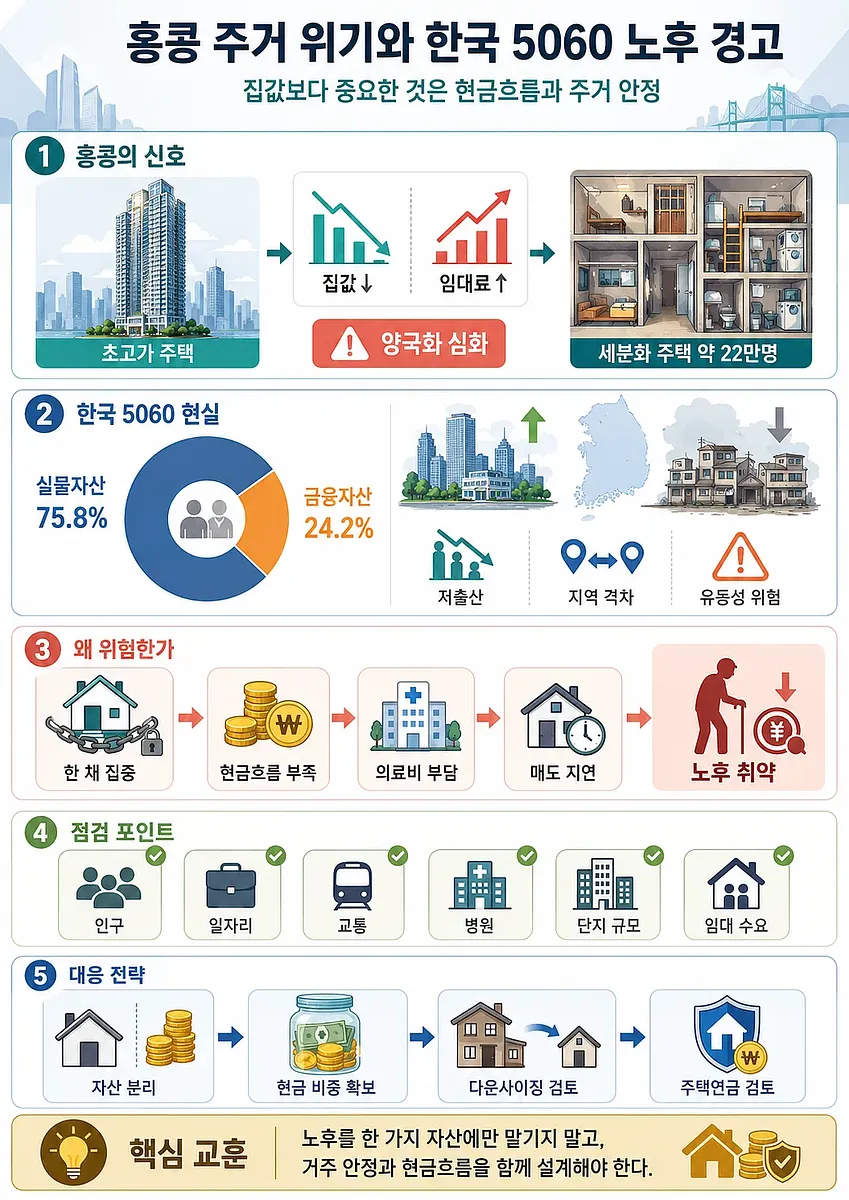
The infographic organizes housing inequality, asset concentration, retirement risks, and planning steps for Korea’s 5060 generation. Hong Kong’s Housing Crisis: A Warning for South Koreans in Their 50s and 60s Regarding Retirement Assets
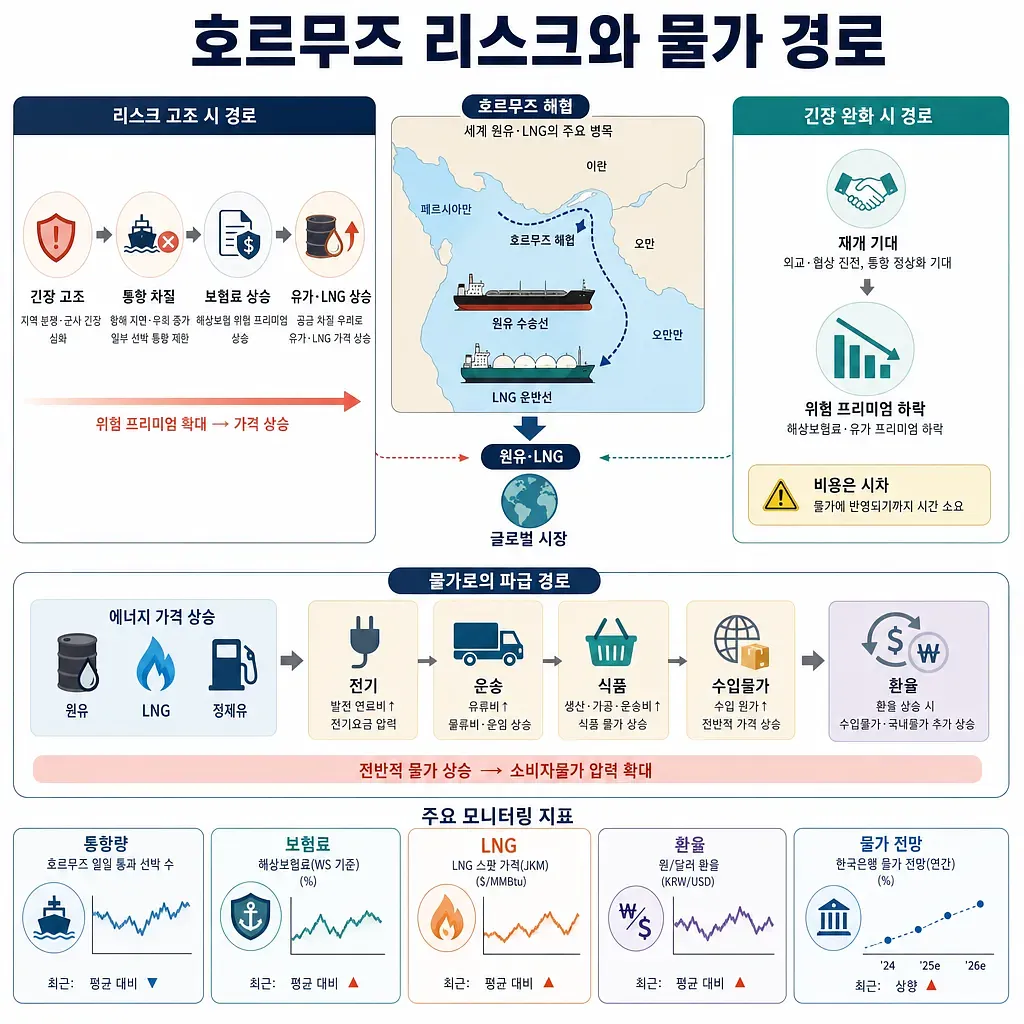
The graphic traces how tensions or easing can move energy prices, shipping, import costs, and exchange rates. How Risks in the Strait of Hormuz Are Once Again Disrupting Oil Prices and Inflation
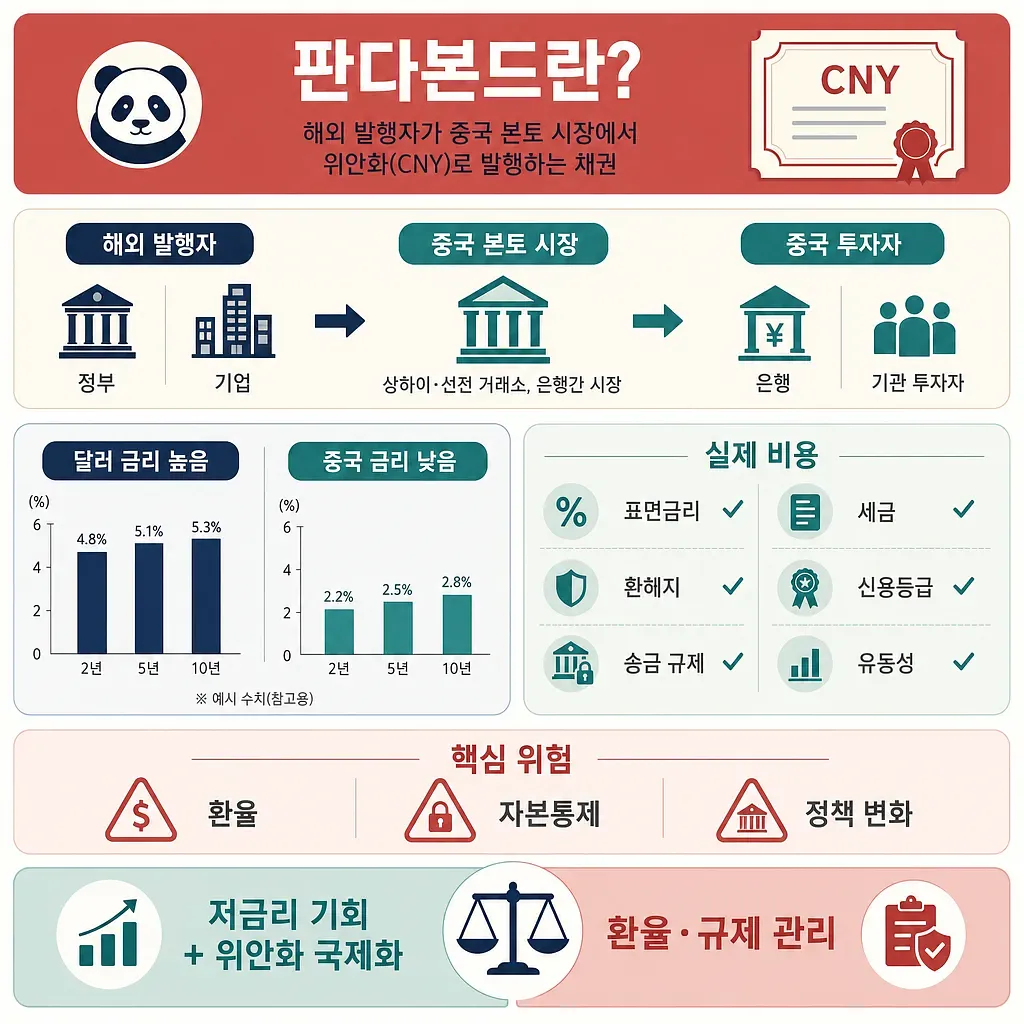
The graphic summarizes how overseas issuers sell yuan bonds in China’s mainland market. Funds are pouring into the Chinese bond market.
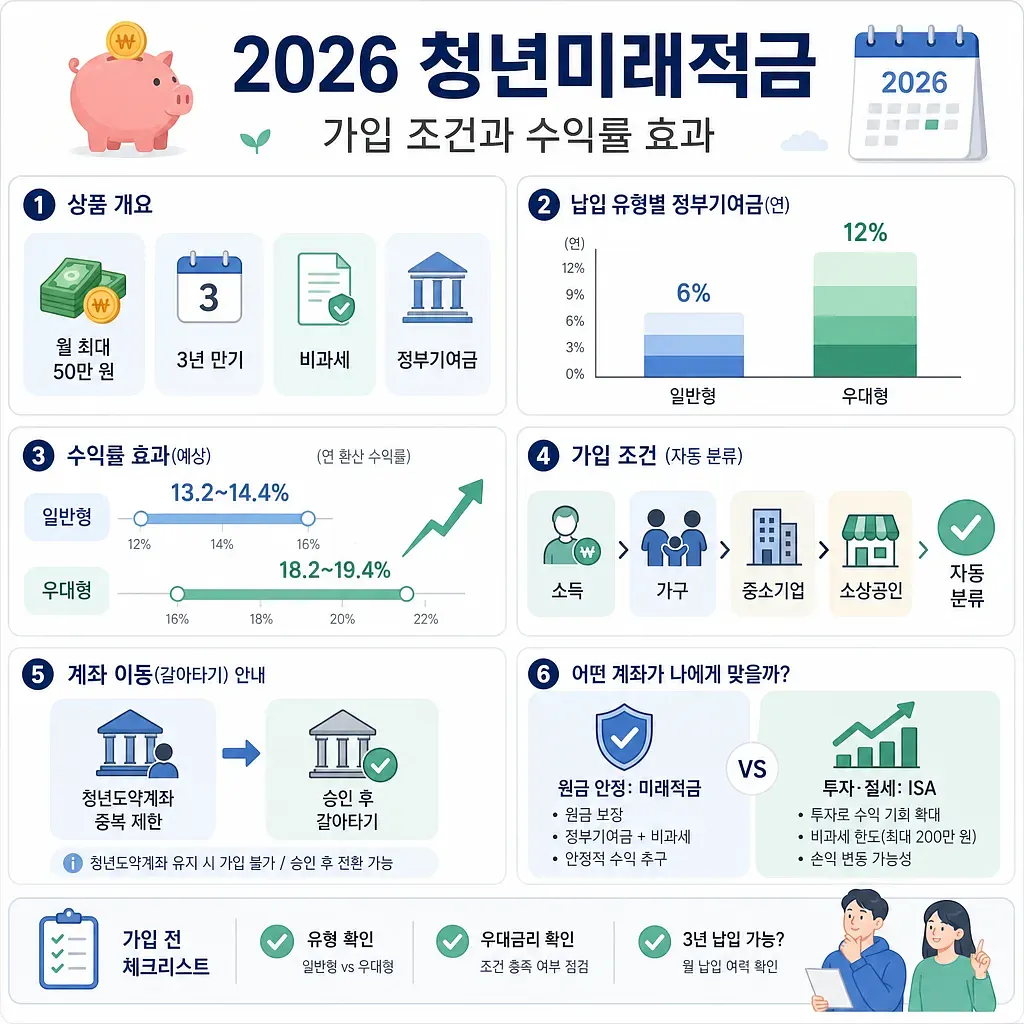
The graphic summarizes 2026 Youth Future Savings conditions, contribution types, expected returns, and account checks. Eligibility Requirements and Return on Investment for the 2026 Youth Future Savings Account
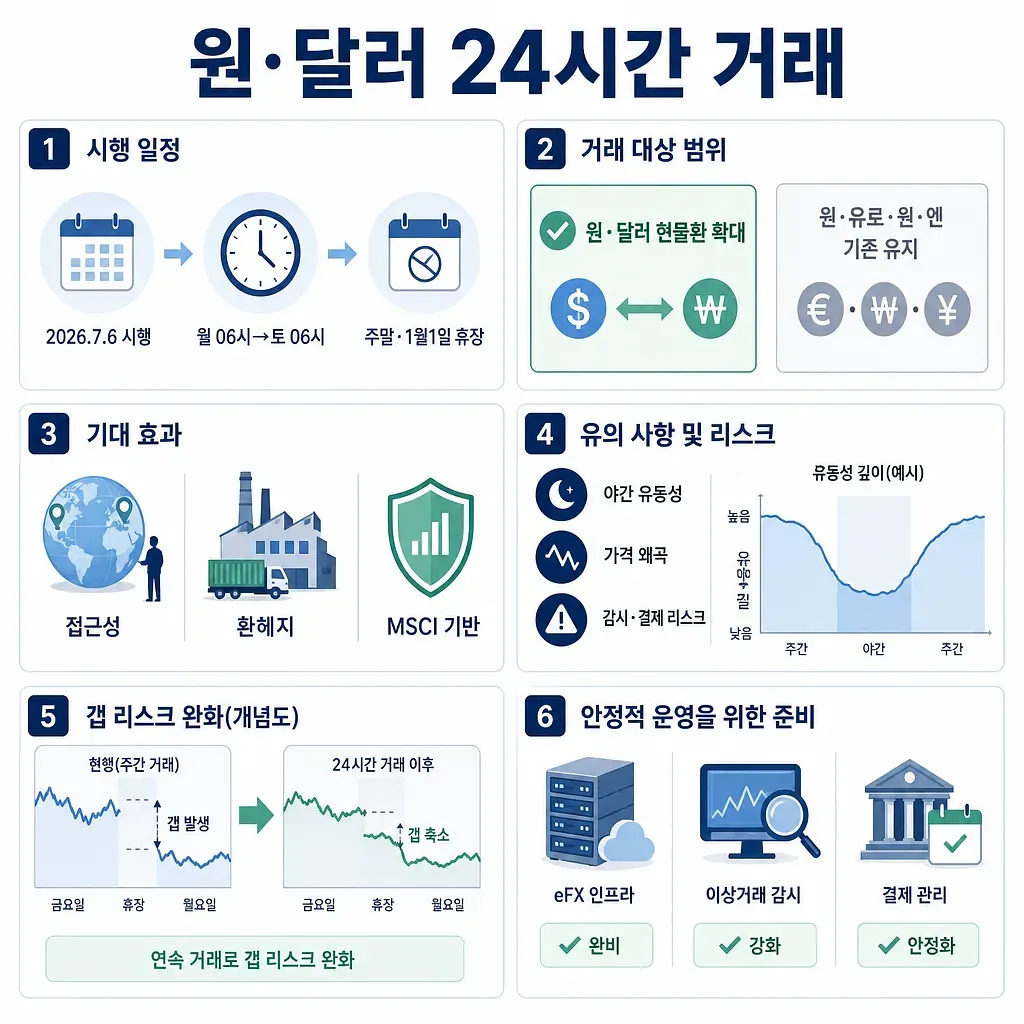
The infographic outlines the rollout and key considerations for 24-hour KRW-USD trading in Seoul. Implementation of 24-Hour Won-Dollar Trading: The Implications and Risks of Expanding Trading Hours in the Seoul Foreign Exchange Market
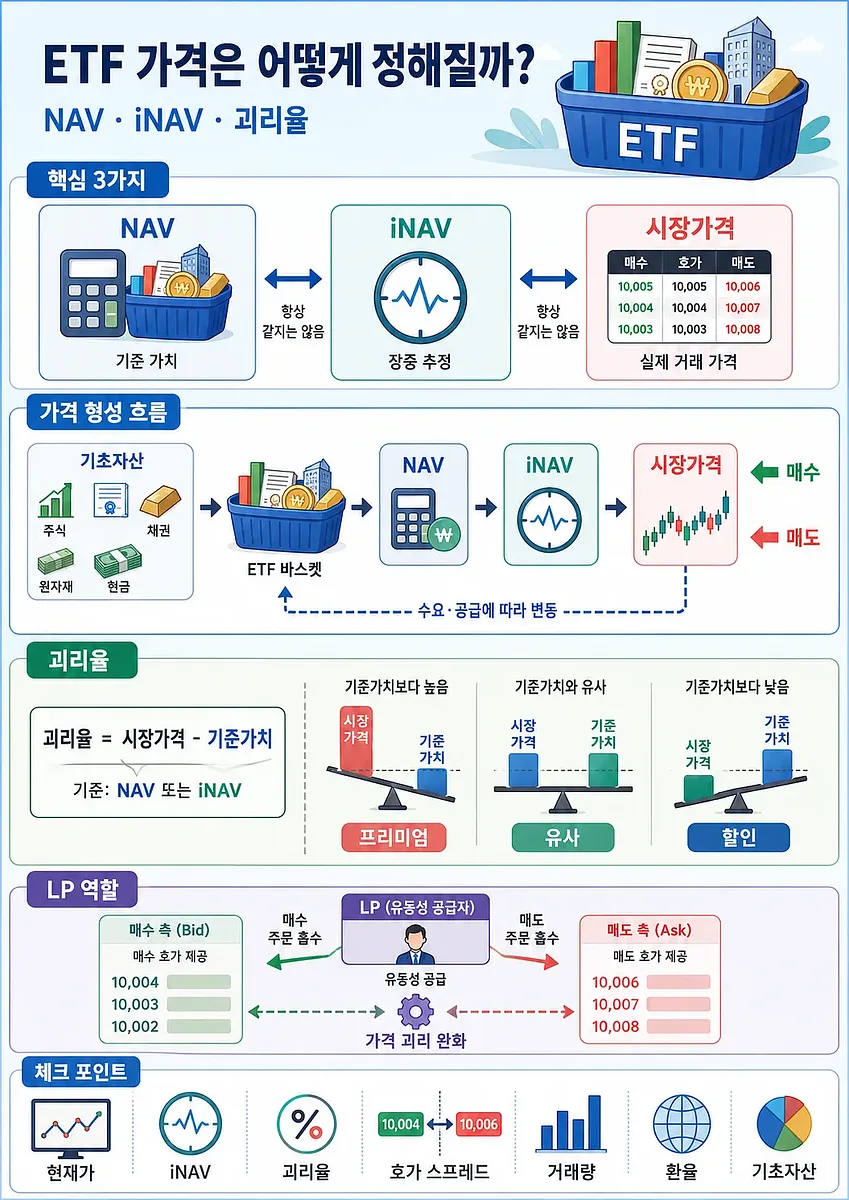
This infographic summarizes ETF pricing through NAV, iNAV, market price, deviation, LP roles, and key checks. How Are ETF Prices Determined? Understanding NAV, iNAV, and the Tracking Error
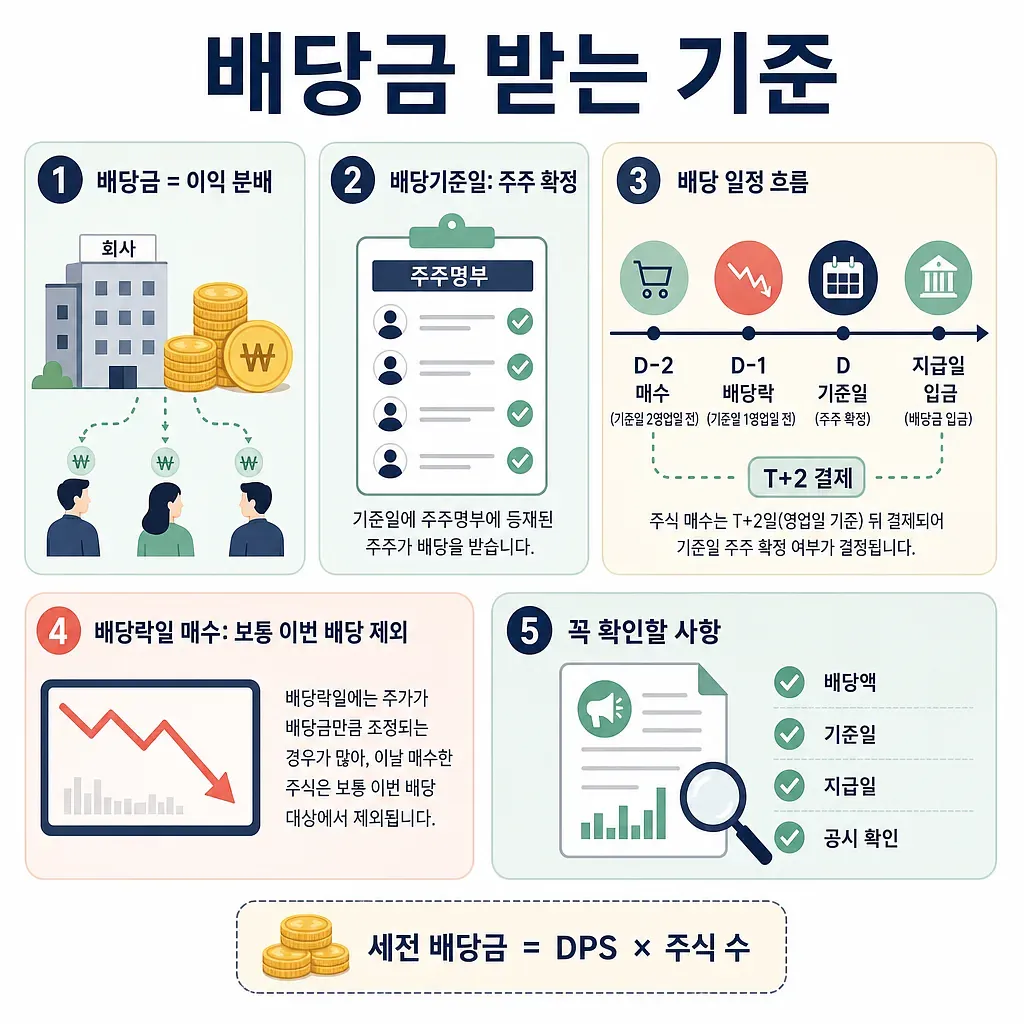
The graphic summarizes record date, ex-dividend date, payment date, and the pre-tax dividend formula. When and Who Is Eligible to Receive Dividends? A Complete Guide to the Ex-Dividend Date and Record Date
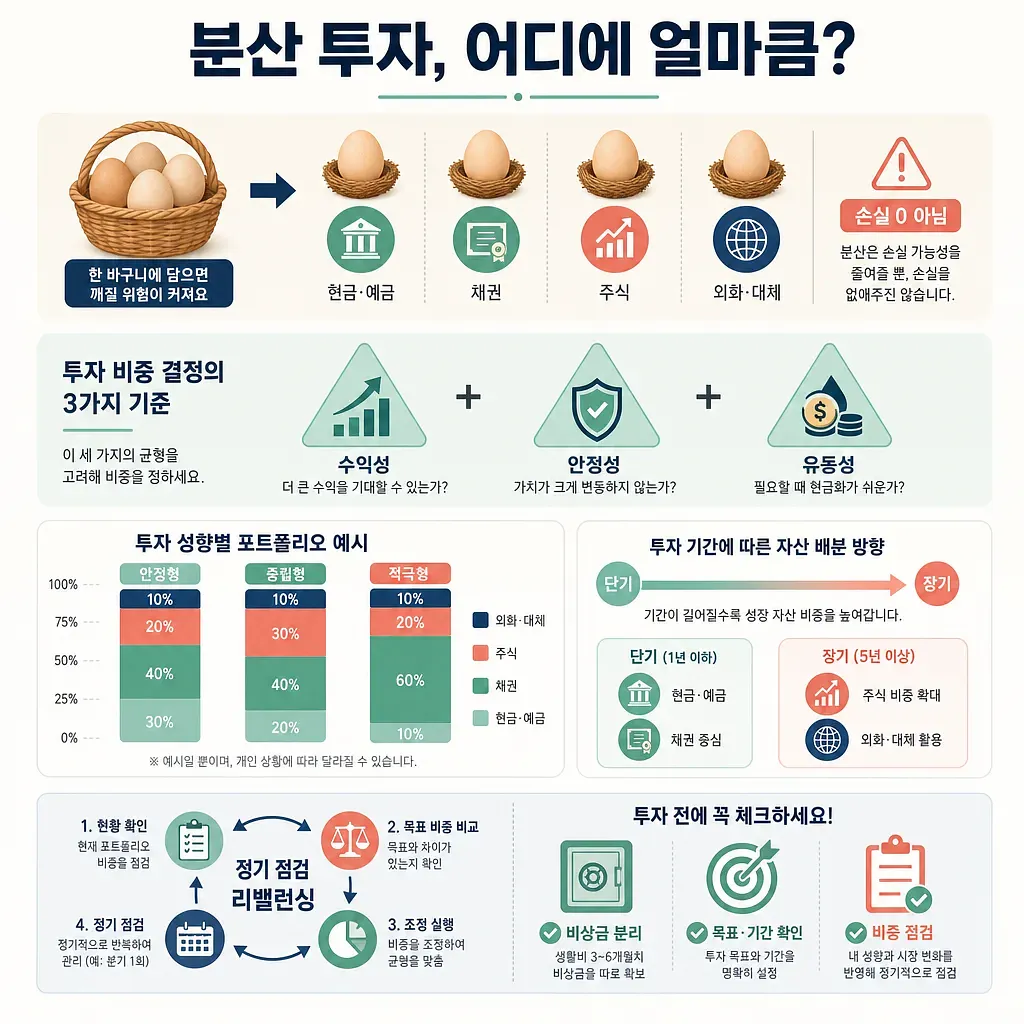
The infographic explains asset allocation by return, stability, liquidity, time horizon, and rebalancing. Diversified Investing: Where and How Much Should You Invest?