Injoys
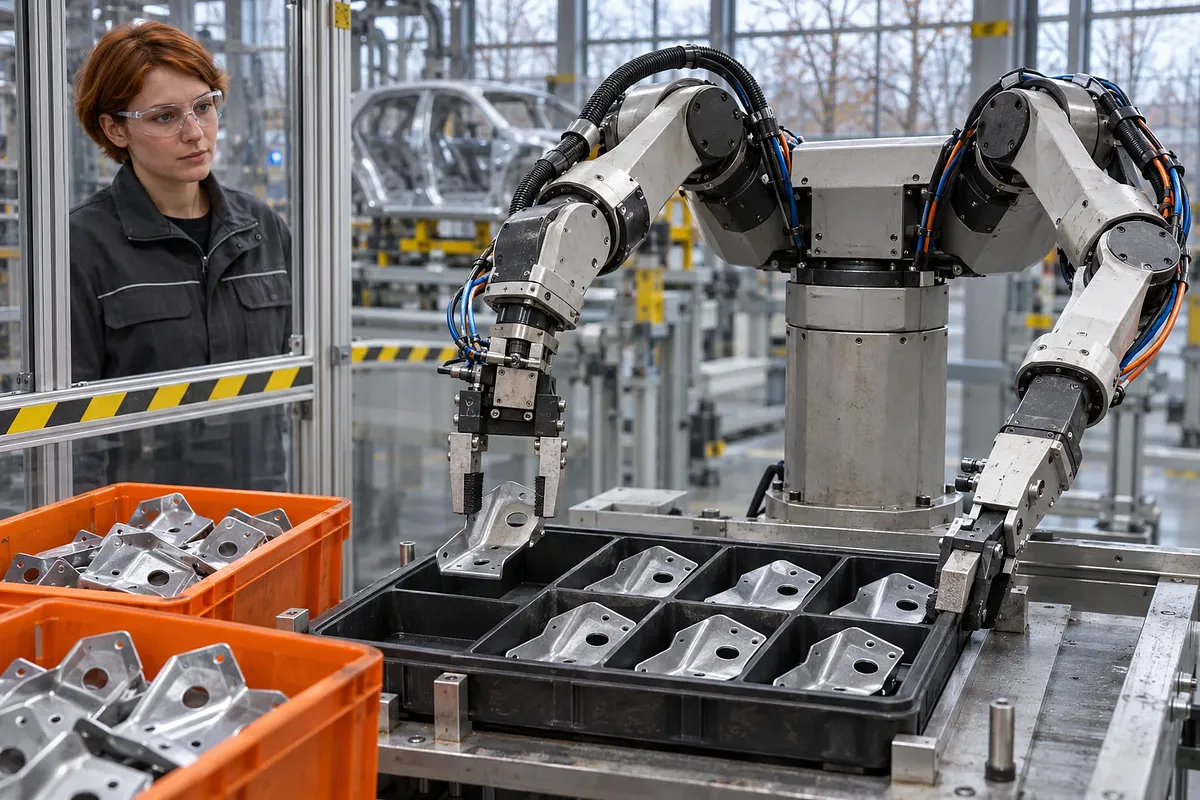
Gemini Robotics 2.5 is a VLA model that connects vision and language to robot actions. The 96% success rate in the factory demonstration applies only to parts kitting. Decisions about actual deployment require further validation of failure recovery and operating conditions.
The performance figures in this article are based on Google's November 10, 2026 announcement.
How VLA and ER Work
VLA is a model that connects visual information and language instructions to robot actions. The name stands for Vision-Language-Action. ER stands for embodied reasoning, which plans tasks in physical environments.
The two models divide responsibilities in the factory demonstration. Gemini Robotics ER tracks the overall workflow. Gemini Robotics 2.5 controls both hands and arms.
| Component | Role | Key distinction |
|---|---|---|
| Visual information | Identifies objects and the surrounding scene | Input used to determine actions |
| Language instructions | Communicate the task and its conditions | Input that expresses task goals |
| ER model | Manages multistep plans and progress | High-level reasoning |
| VLA action model | Generates robot movements | Control for physical actions |
| Robot hardware | Executes movements and object manipulation | Physical devices such as hands, arms, and actuators |
The ER model is designed to determine what to do next and keep execution moving. It also determines whether a task is complete and whether a retry is needed. The official model information specifies that ER 2 outputs text. Google DeepMind's ER 2 description
The action model and the physical robot are not the same product. The official VLA description outlines a control scope ranging from arms to a humanoid's entire body. Performance on a specific robot must be interpreted alongside that hardware's conditions. Google DeepMind's VLA description
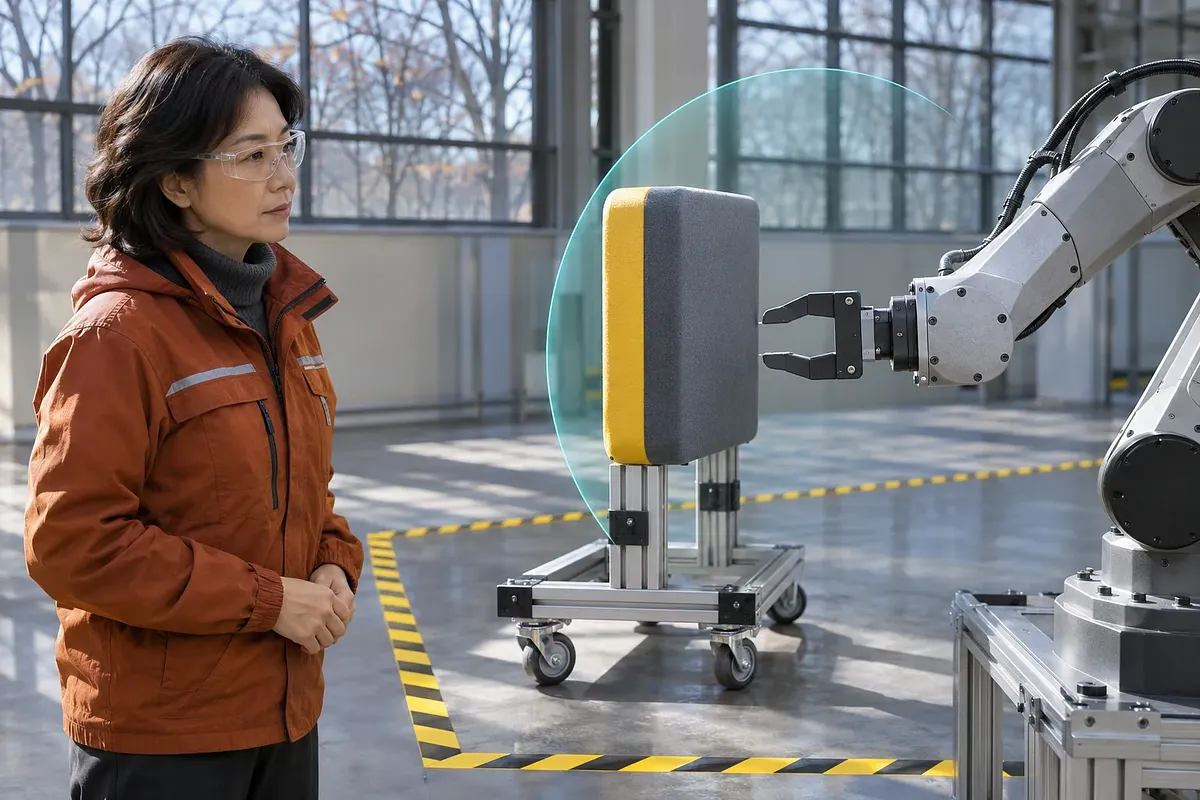
Task success rates and safety evaluations must be considered separately.
Task Evaluation Figures and Comparison Baselines
The announced improvement rates are results compared with the previous baseline model. They are not absolute success rates that apply to all tasks. The announcement explains that the extent of improvement varied by task type.
The following table separates the figures announced on November 10, 2026.
| Item | Announcement | Scope of the figure |
|---|---|---|
| Number of evaluation tasks | The introduction says more than 200; the detailed description says 200 | Understand the overall scale as around 200 |
| Task success rate | 30~100% improvement over the previous baseline model | Relative improvement by task type |
| Task completion speed | 20~30% improvement over the previous baseline model | Comparison of completion speeds for evaluation tasks |
| Factory demonstration success rate | 96% | Apollo 2's automotive parts kitting demonstration |
The task count refers to the types of tasks evaluated. This is different from the number of times each task was repeated. Statistical confidence therefore cannot be calculated from the task count alone. Google's Korean-language announcement
Examples of Relative Improvement Calculations
Converting success rate improvements into multiples makes their meaning clearer. The announced 30% improvement corresponds to 1.3 times the previous success rate. A 100% improvement means twice the previous success rate. These relationships are calculated from the announced figures.
| Expression | Calculation | Information needed for interpretation |
|---|---|---|
| 30% improvement in success rate | New success rate = previous success rate × 1.3 | Previous success rate for the same task |
| 100% improvement in success rate | New success rate = previous success rate × 2 | Previous success rate for the same task |
| Difference in success rates | New success rate - previous success rate | Both absolute success rates, measured in percentage points |
Without the baseline success rate, the new absolute success rate cannot be calculated. A 100% improvement must not be read as success on every attempt. Speed improvements also cannot be converted into increases in total factory output.
The Scope of the 96% Factory Demonstration Success Rate
The announced 96% is the success rate for an automotive parts kitting demonstration. Kitting is the task of preparing parts for assembly in the required sequence. Apptronik's Apollo 2 performed this task in the demonstration.
The demonstration took place on actual Mercedes-Benz production lines. The announcement specifies Kecskemét, Hungary, and Sindelfingen, Germany. The robot picked metal brackets from supply bins and placed them in containers arranged by sequence.
A proof of concept, or PoC, is a test that checks feasibility in a specific environment. The success rate measured here applies within the scope of that test. It cannot be extended to the factory's overall automation rate or the success rate of every process.
Google outlined a use case in which robots handle repetitive preparation tasks. It explained that this helps technicians focus on complex assembly. It did not provide figures for workforce reductions or increases in labor productivity. Google DeepMind's factory demonstration description
Failure Recovery and Throughput Missing from the Success Rate
Decisions about factory deployment require the denominator of the success rate and the recovery time. Even with the same success rate, output can vary depending on how retries are handled. This analysis connects the announced figures to operational metrics.
| Item to check | What to verify | Effect on the decision |
|---|---|---|
| Unit of success | Whether it is one part or an entire tray | The scope of work represented by the success rate |
| Number of attempts | Total evaluation attempts and their distribution by task | Variability and representativeness of the results |
| Retry handling | Whether success means first-attempt success or includes retries | Level of autonomous performance |
| Human intervention | Number and timing of interventions | Required operating staff |
| Failure recovery | Recovery time and conditions for resuming work | Throughput lost to interruptions |
| Quality assessment | Criteria for positional errors and part damage | Whether the output can be used in subsequent assembly |
| Continuous operation | Operating time and causes of stops | Stability in actual operation |
These items are not additional verified achievements. They are measurement conditions that must be checked separately in on-site evaluations. The Korean-language announcement alone does not establish all the detailed conditions.
Good-unit throughput can also be calculated as an operational metric. The formula is “completed units that pass quality criteria ÷ total operating time.” Total operating time must include retries and recovery time. This is a proposed measurement, not a figure announced for the factory demonstration.
Robot operations also require management functions beyond the model. Apptronik describes Fleet Connect for status monitoring and task assignment. It shows that the scope of operations must also cover batteries and stopped states. Apptronik's Apollo 2 platform description