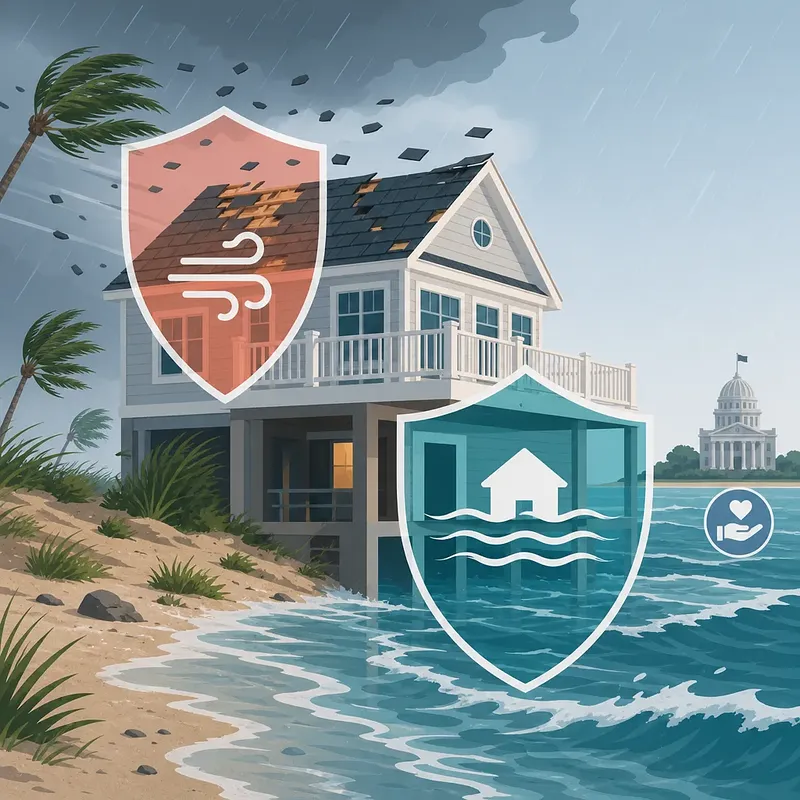
Injoys
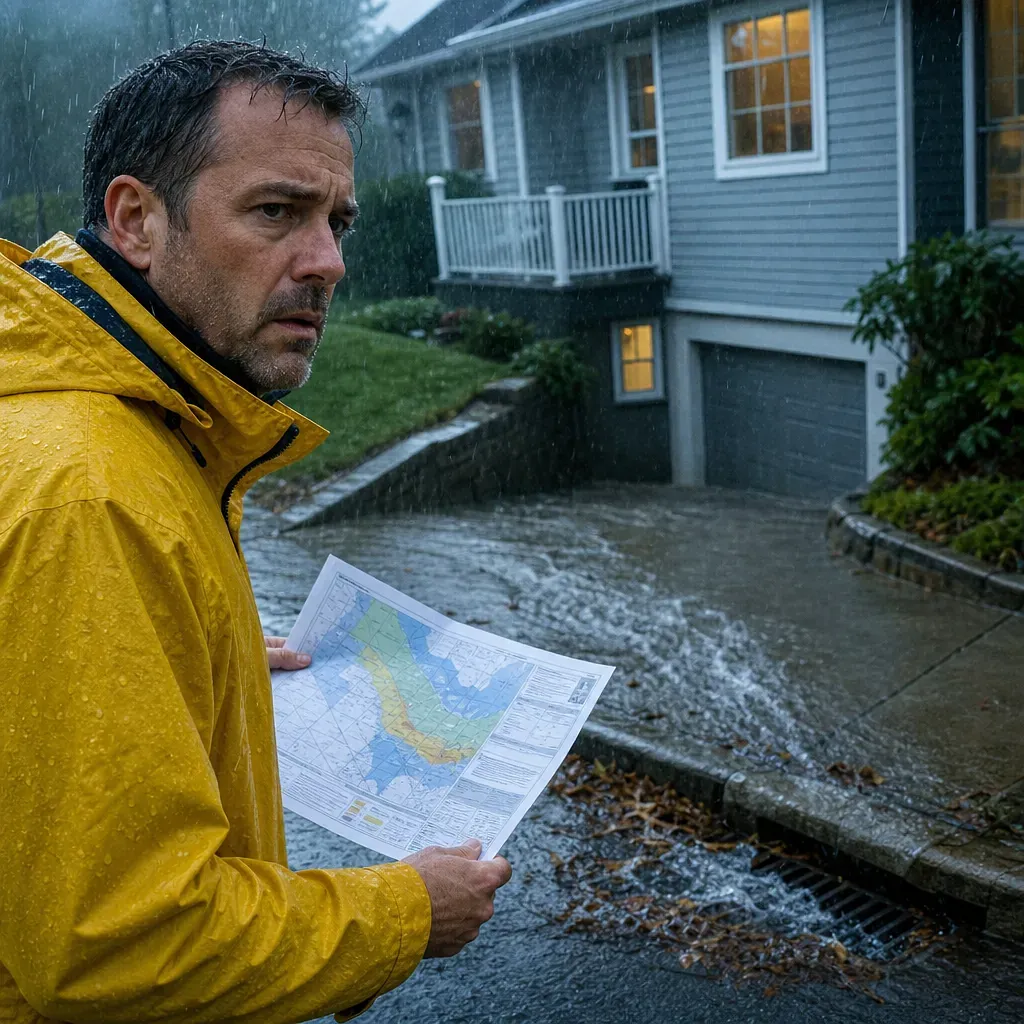
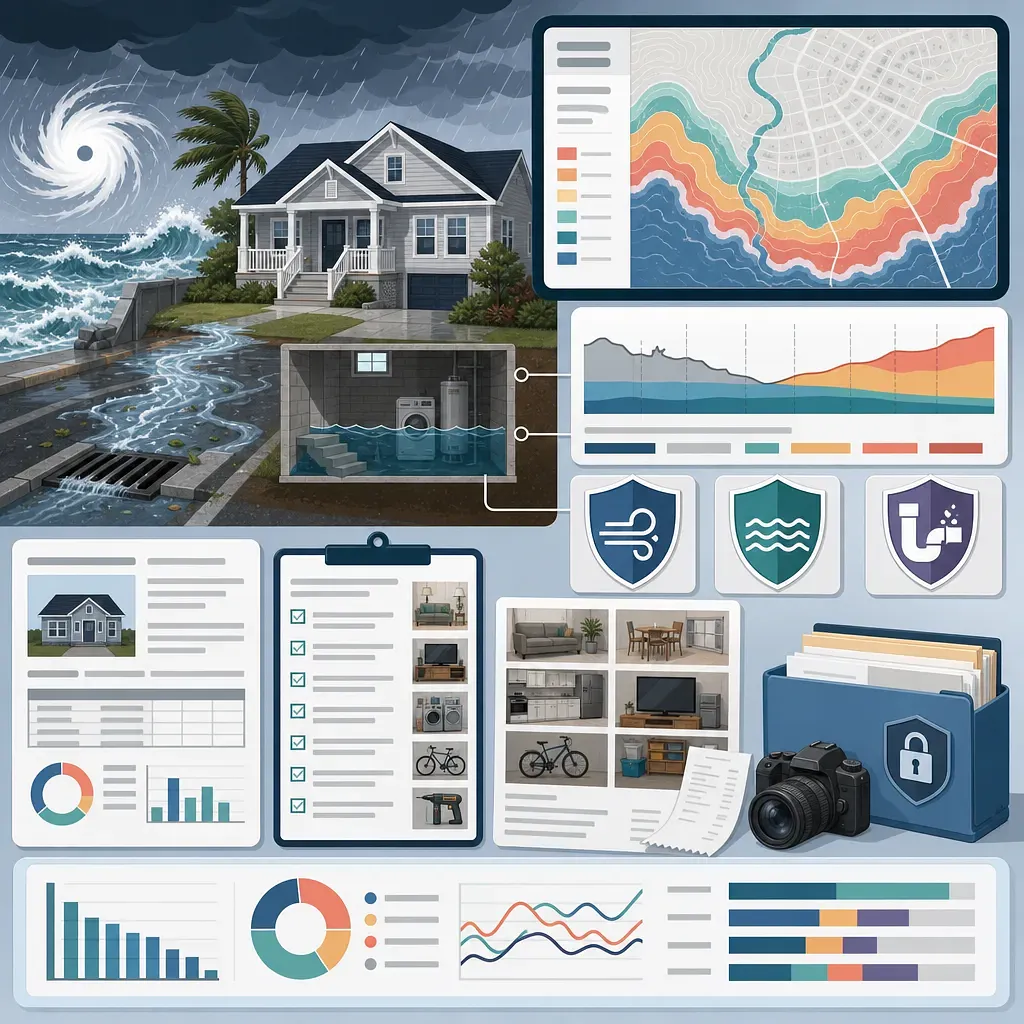
FEMA flood maps in the United States are the first resource to check when assessing a home’s flood risk. However, being outside a high-risk zone on the map is not a guarantee that a home “will not flood.” To understand the actual risk more accurately, consider not only river flooding and coastal inundation but also heavy rainfall, drainage-system limitations, storm surge, building elevation, and past damage.
Even if the early part of the 2026 Atlantic hurricane season has been relatively quiet, that is not a reason to end preparations. Tropical cyclone activity in the Atlantic generally tends to increase rapidly from late August. Forecasts for an individual season and current storm information should be verified against the latest updates from the National Hurricane Center, rather than private commentary.
Why a Quiet Start to the Season Is No Reason to Relax
The official dates of the Atlantic hurricane season should be confirmed in the National Hurricane Center’s latest guidance. Climatologically, activity tends to increase rapidly from late August, but this does not predict landfall on a specific date or in a specific area.
The number of storms early in the season alone cannot reliably indicate the risk to an individual home for the following reasons:
- A single hurricane or tropical storm can cause extensive damage depending on where it makes landfall and how quickly it moves.
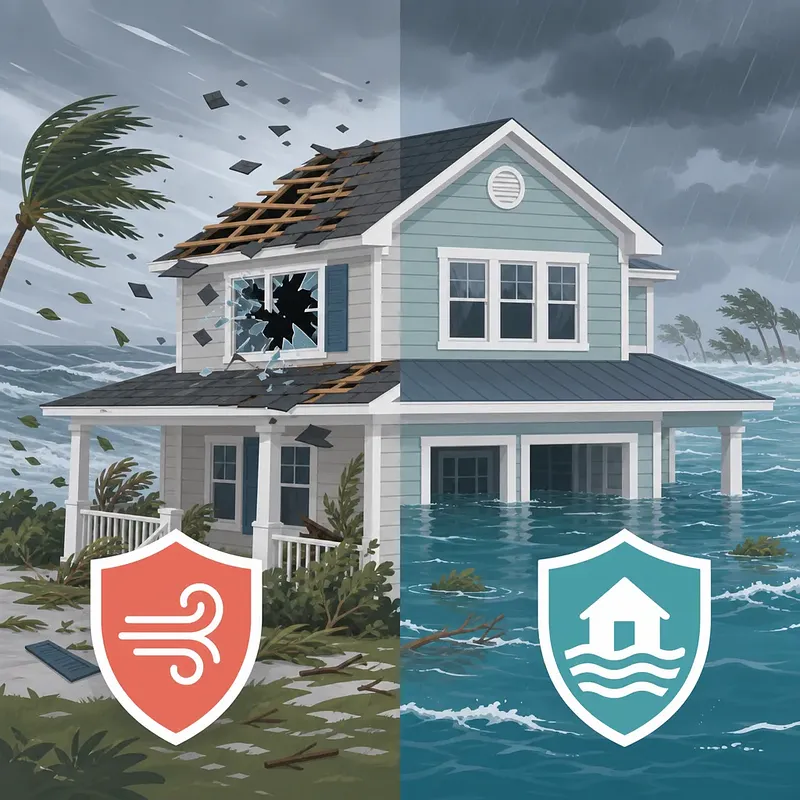
- A hurricane’s category primarily reflects its maximum sustained wind speed and does not directly indicate rainfall amounts or flood depths at a specific address.
- Areas far from the center can also be affected by rainbands, river flooding, tornadoes, or storm surge.
- Even a weak tropical cyclone can bring heavy rainfall to one area if it moves slowly.
- Flood insurance may generally not take effect immediately after purchase, so waiting until a storm is imminent may be too late.
Therefore, “it has been quiet so far” and “the risk to my home for the rest of the season is low” are two different conclusions.
What FEMA Flood Zones Show
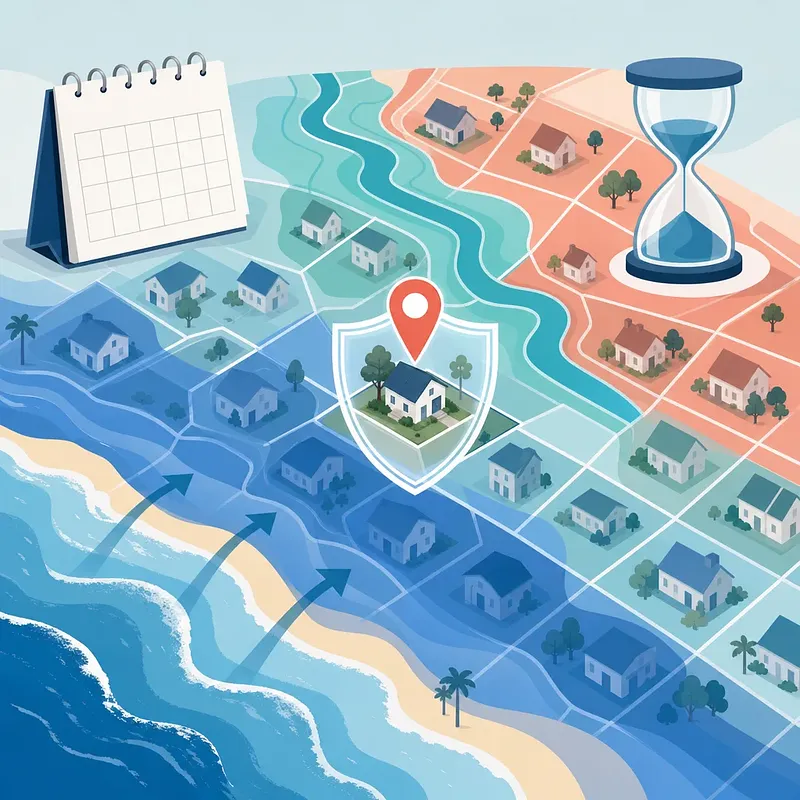
FEMA’s Flood Insurance Rate Map divides modeled hazards into zones, including river flooding, coastal inundation, and wave action. These maps are used for local land use and building standards, flood insurance requirements during the lending process, insurance, and risk management.
| Representative zone | General meaning | Points to consider when interpreting it |
|---|---|---|
| A zones | Special Flood Hazard Areas designated by FEMA as having base-flood risk | The exact probability standard should be confirmed in FEMA’s latest official zone definitions, and depending on the specific zone, the base flood elevation may be shown or may not yet have been determined. |
| V zones | Coastal high-risk areas designated by FEMA where wave action is also expected | Confirm the exact probability standard in FEMA’s latest official zone definitions, and also consider the forces that storm surge and waves can exert on structures. |
| Shaded X | Generally includes areas with a moderate level of flood risk | The exact probability standard should be confirmed in FEMA’s latest official zone definitions, and major floods can occur even at a low frequency. |
| Unshaded X | Areas mapped as having lower risk than Special Flood Hazard Areas | This does not mean that heavy rainfall and localized drainage problems are absent. |
| D | Areas where flooding is possible but the risk has not been sufficiently analyzed | A lack of data should not be interpreted as evidence of safety. |
The base-flood probability does not mean that such a flood occurs only once at regular intervals, and the exact probability standard should be confirmed in FEMA’s latest official guidance. It is a statistical standard under which the same probability applies each year, and such floods can occur in multiple consecutive years. In addition, the longer a property is held, the greater the cumulative chance of experiencing at least one base flood.
FEMA maps may include not only maps currently in effect but also preliminary maps undergoing revision and map-change documents for individual parcels. That is why, after searching an address, it is important to check the effective date and revision status of the map panel.
Flood Risks That May Not Appear on Official Maps
It is inappropriate either to conclude that FEMA maps are inaccurate and therefore useless or to assume that being outside a mapped zone means a property is safe. Official maps are models designed for specific purposes and probability standards, so they do not fully represent every form of water damage.
Heavy Rainfall and Urban Flooding
When enough rain falls in a short time to exceed the capacity of drainage systems, homes far from rivers or the coast can also flood. Water can collect at low points in roads, parking lots, basement entrances, areas around retaining walls, and basement windows. This type of rainfall-driven and surface flooding may not be fully represented on maps focused on river flooding.
Inland Spread of Storm Surge
Storm surge occurs when wind pushes seawater toward the coast. It can spread inland through low-lying areas, bays, estuaries, and waterways, and FEMA insurance maps and the National Hurricane Center’s storm surge hazard maps have different purposes and assumptions. The two maps should be treated as complementary resources, not substitutes.
Outdated Terrain, Rainfall, and Development Conditions
Roads, housing developments, levees, drainage channels, and impervious surfaces may change after a map is created. If new development alters the flow of water or drainage facilities deteriorate, current localized risk may differ from conditions when the map was produced. In addition to the map panel’s effective date, it is necessary to check the latest flood and drainage maps and construction plans from local governments.
Overconfidence in Levees and Drainage Systems
The presence of a levee or pump does not eliminate risk. Water may exceed the design level, equipment may fail, power outages may occur, drains may become blocked, or water may flow around a levee. Residual risk remains even in areas where the map accounts for protective effects.
Resources to Check for a Specific Address
An accurate assessment is possible when multiple sources are overlaid rather than relying on a single map.
- Search the address in the FEMA Map Service Center and check the currently effective map panel, zone, and effective date.
- Review flood complaints, drainage facilities, waterways, low-lying areas, and evacuation zones in the local government’s or county’s GIS.
- For coastal areas, separately check the National Hurricane Center’s storm surge hazard maps.
- Ask the seller, previous owner, or property manager about past flooding, water intrusion, mold remediation, and repair history.
- If possible, review survey data or an Elevation Certificate to determine where the building’s lowest floor and major equipment are located relative to the base flood elevation.
- Ask the insurer or agent in writing for the coverage, deductible, waiting period, and estimated premium of currently available flood insurance.
Past insurance claim history is not information available to everyone because of privacy or contractual relationships. Homebuyers should review the seller-disclosure requirements in the relevant state and separately inspect for signs of water damage during the home inspection and insurance-quote process.