Injoys
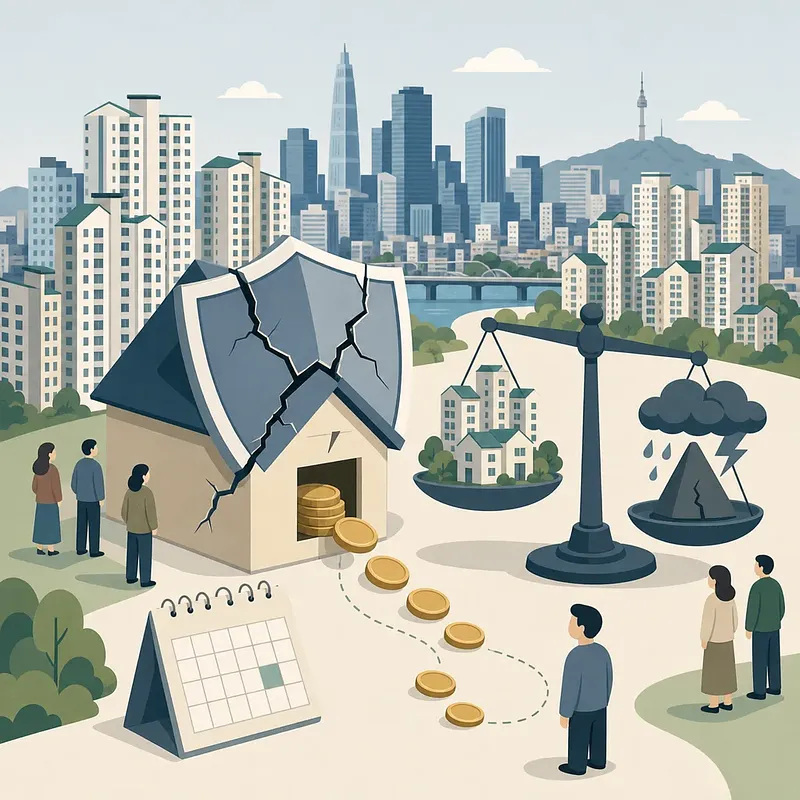
When home sale prices, jeonse prices, and monthly rents rise together, housing costs increase across all options. However, this phenomenon should not immediately be interpreted as a nationwide supply collapse or a signal to buy. Price indexes may differ from actual transaction prices, and even within Seoul, trends may diverge by housing type, price range, and local living area.
The following summarizes the data needed to assess the Korean housing market and the preparation process for tenants and people without a home. It does not make definitive claims about current growth rates or future prices in any particular area, and the latest public statistics should be checked again before making an actual decision.
Why Sale Prices, Jeonse Prices, and Monthly Rents Can Rise Together
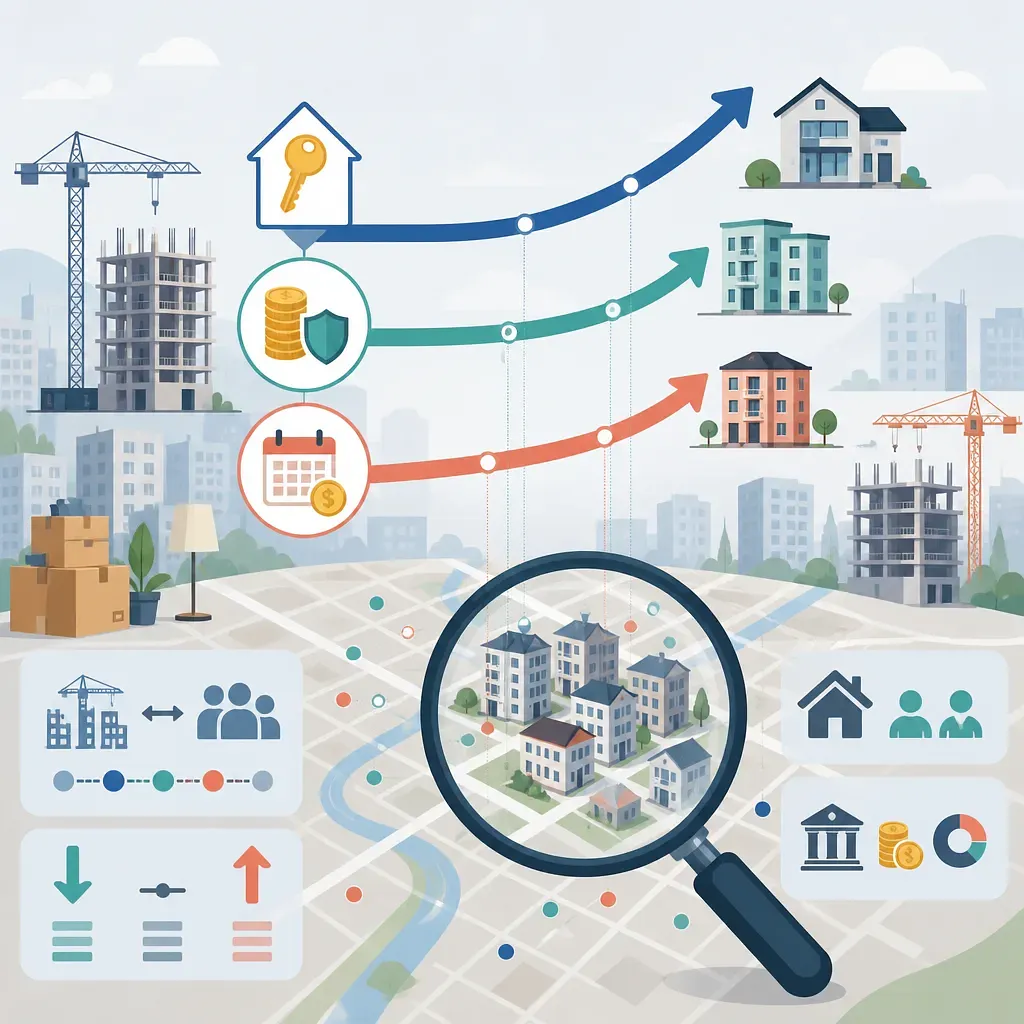
The three markets are not separate. When the supply of jeonse listings decreases or deposits rise, some households move to monthly rentals while others shift to purchasing. If households that find it more difficult to buy because sale prices have risen remain in the rental market, demand for jeonse and monthly rentals may increase again.
| Path | Possible Change | Indicators to Check |
|---|---|---|
| Decline in jeonse supply | Higher jeonse prices, increased conversion to monthly rentals | Jeonse transaction volume, share of monthly rentals, deposits for new contracts |
| Shift from jeonse to purchasing | Increased purchase demand in accessible price ranges | Actual transaction volume by price range, canceled transactions, difference between sale and jeonse prices |
| Reduced purchasing capacity | Households remain in the rental market | Mortgage interest rates, lending regulations, home sale transaction volume |
| Decline in new move-ins | Possible reduction in new jeonse listings and purchase options | Completions and move-in volume, unoccupied units, housing demolitions |
| Concentration of households or jobs | Increased purchase and rental demand in particular local living areas | Number of households, move-ins and move-outs, employment and transportation conditions |
Several causes may drive simultaneous increases. In addition to supply constraints, it is necessary to examine interest rates, borrowing limits, landlords’ ability to return deposits, the conversion of jeonse to monthly rentals, concentration in preferred areas, and changes in the composition of new and older homes.
Why Average Indicators May Differ from What People Experience
A housing price index estimates price changes for a sample of homes, while actual transaction prices are the prices of transactions that were actually reported. When there are few transactions, a small number of high- or low-priced deals can have a major impact on market perceptions. Monthly rentals also involve different combinations of deposits and monthly rent, so comparing only average monthly rent can be misleading.
Therefore, the statement that “Seoul has risen” alone cannot establish that prices in a particular neighborhood or apartment complex have increased. Comparisons should be made across narrower local living areas than autonomous districts, while matching housing size, year of completion, and price range.
How to Verify the Claim That “Outlying Areas Rise First”
The claim that relatively lower- and mid-priced areas such as Nowon, Guro, and Gwanak rise before Gangnam and Seocho should be verified after defining the period and indicators. It is difficult to establish a trend based only on a price index for a particular week, a few record-high reported transactions, or asking prices.
- Compare regional home sale price indexes for the same period from the Korea Real Estate Board or KB Real Estate.
- Check recent transactions for units of the same size and on similar floors through the Ministry of Land, Infrastructure and Transport’s Actual Transaction Price Disclosure System.
- Determine whether transaction volume also increased or whether only prices changed while transactions remained scarce.
- Check transactions that were terminated or canceled, as well as transactions reported late.
- Review actual jeonse transactions, the number of listings, and the time required to close contracts together.
- Check local factors such as move-ins, relocations due to reconstruction, and new transportation links in the area.
Even if lower- and mid-priced areas are confirmed to be rising first, the cause cannot be attributed solely to “survival buying.” Demand may have shifted toward price ranges that fit borrowing limits, or move-ins, redevelopment projects, or demand for particular school districts may have affected specific complexes.
Jeonse Shortages Must Be Examined Separately in Terms of Price and Supply
The expression “there is no jeonse” may describe at least three situations.
- The actual number of jeonse listings and new contracts has decreased
- Jeonse listings exist, but none meet the desired location, size, and budget
- Jeonse units have been converted to monthly rentals or deposit-based monthly rentals
A decline in jeonse transaction volume does not necessarily mean the homes themselves have disappeared. The same homes may have been converted to monthly rentals, or existing tenants may have renewed their contracts, keeping the units off the public market. Conversely, even if there appear to be many online listings, they may include duplicates and promotional listings, so they should be compared with properties that can actually be contracted through local brokers.
How to Use the Jeonse-to-Price Ratio Correctly
The jeonse-to-price ratio is generally calculated by dividing the jeonse price by the sale price. A high ratio means that the gap between the sale price and jeonse price is small, but it does not mean that purchasing is safe or that prices will rise in the future.
For example, even if both sale prices and jeonse prices decline, the jeonse-to-price ratio may rise if sale prices fall faster. When reviewing the jeonse-to-price ratio, the following should also be checked.
- Actual sale and jeonse contracts for the same unit size in the same complex
- Senior-ranking claims and existing deposits
- Eligibility for deposit guarantee coverage under officially assessed value or recognized market-price criteria
- Future move-in volume and periods when jeonse expirations are concentrated
- Transaction volume and whether listings remain on the market for extended periods
Indicators to Check When Assessing a Supply Shortage
Housing supply is not a single number but a lengthy process.
| Stage | Meaning | Points to Consider When Interpreting |
|---|---|---|
| Permits and approvals | The administrative basis for pursuing a project has been established | They may be canceled or modified, or construction may take a long time to begin |
| Construction starts | Actual construction has begun | Construction may be delayed or the project may be suspended |
| Completion | The building has been completed | The completion date may differ from the actual move-in date |
| Scheduled move-ins | Estimate of homes entering the market during a particular period | Schedule changes and differences in rental and for-sale composition should be checked |
| Demolition | Existing housing decreases due to demolition or similar causes | Demolitions must be subtracted from new supply to determine the net increase |
Forecasts that “annual move-in volume in Seoul will be tens of thousands of homes in the coming years” may vary depending on the research organization and counting criteria. It is necessary to check whether they include only apartments, whether public and private rentals and non-apartment housing are included, and whether changes to redevelopment project schedules have been reflected.
Redevelopment projects are an important supply channel in Seoul, but not all new supply comes solely from redevelopment and reconstruction. Public housing, small-scale redevelopment, non-apartment housing, and building-use conversions may also be included in supply. Redevelopment projects can also create housing demolitions and relocation demand before completion, placing pressure on nearby rental markets in the interim.