Injoys

Stock investment opportunities should be judged by earnings prospects and purchase prices, not the intensity of fear. Semiconductor earnings growth has been confirmed. But an increase in liquidity alone does not guarantee rising stock prices. Set your investment allocation based on when you will need the money.
Corporate earnings figures are based on company announcements made on April 7 and October 28~29, 2026.
Facts Confirmed by Semiconductor Earnings
Samsung Electronics' reported operating profit growth of 755% is an actual announced figure. However, it refers to preliminary results for the first quarter of 2026. It should not be interpreted as an annual growth rate or as the upside potential of the current share price. Samsung Electronics' First-Quarter Preliminary Results Announcement
If you are making a decision in November 2026, you should also check the third-quarter announcements. Samsung Electronics cited expanded HBM4 sales as a driver of its results. SK hynix also reported increased sales of high-value server products. The two companies' announcements show that AI-related demand translated into earnings. Samsung Electronics' Third-Quarter Results Announcement, SK hynix's Third-Quarter Results Announcement
| Company and reporting period | Consolidated revenue | Consolidated operating profit | Announcement date and type |
|---|---|---|---|
| Samsung Electronics, first quarter of 2026 | KRW 133 trillion | KRW 57.2 trillion | April 7, 2026, preliminary results |
| Samsung Electronics, third quarter of 2026 | KRW 195.3 trillion | KRW 107.4 trillion | October 29, 2026, results announcement |
| SK hynix, third quarter of 2026 | KRW 104.6155 trillion | KRW 83.3338 trillion | October 28, 2026, results announcement |
SK hynix stated that its accounting review was not complete at the time of the announcement. When reading subsequent reports, check whether the figures have been revised. Figures announced by a company should be distinguished from financial statements whose audit or review has been completed.
Earnings growth alone cannot tell you how long a boom will last. You also need to examine the expectations already reflected in the current share price. An investment decision requires assessing whether future sales volumes and prices can be sustained.
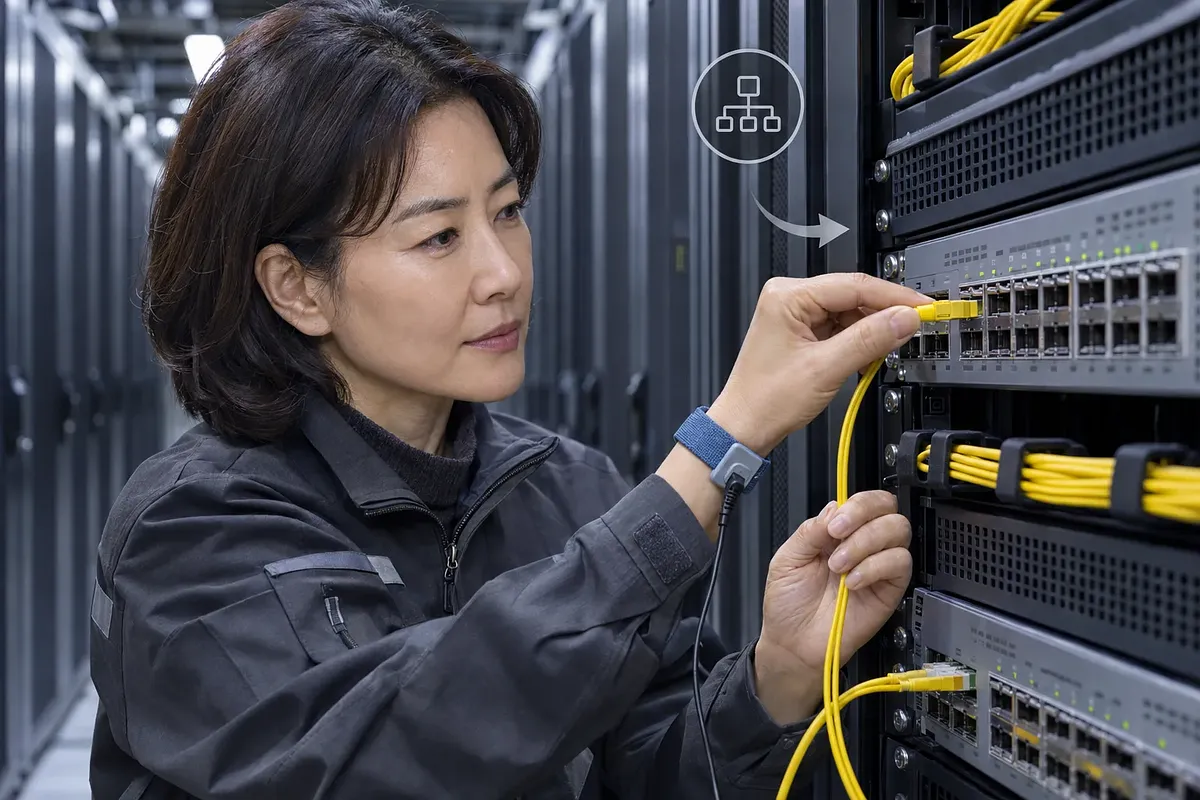
For telecom infrastructure, check how each company’s orders translate into earnings.
Criteria for Judging Undervaluation Using Forward P/E
Forward P/E is the current share price divided by expected earnings per share. Earnings per share is the net income attributable to one share of stock. Operating profit cannot be used directly as the denominator in a P/E ratio. CFA Institute's Explanation of Price Multiples
- Trailing P/E: A measure that uses earnings per share from recent results
- Forward P/E: A measure that uses expected future earnings per share
- 12-month forward P/E: A measure that uses expected earnings per share for the next 12 months
- Fiscal-year forward P/E: A measure that uses expected earnings per share for a specific fiscal year
A forecast of KRW 300 trillion in annual operating profit alone is not enough to calculate a P/E of 4. First, identify which company the forecast concerns. Then check its expected net income and number of shares. The date of the share price is also needed for the calculation.
The claim that the S&P 500 trades at less than 20 times earnings also needs a reference date. The claim that the KOSPI trades at 8~9 times earnings likewise requires checking the source of the calculation. These figures have not been verified as current market values in this article. Check the period covered by the earnings forecast in your brokerage's explanation of the metric.
| Comparison item | Basis that must match | Problem if the basis differs |
|---|---|---|
| Share prices and indexes | Same trading day | Mistaking price changes for differences in value |
| Expected earnings | Same forecast period | Mixing this year's earnings with earnings for the next 12 months |
| Definition of earnings | Same accounting and adjustment basis | Differences in whether one-time gains and losses are included |
| Companies being compared | Similar business structures | Mistaking industry differences for undervaluation |
| Forecast data | Same preparation date | Assessing current prices using outdated forecasts |
A low P/E may reflect expectations of declining earnings. Companies that are highly sensitive to economic conditions can have low P/E ratios during a boom. You therefore need to assess whether current earnings can be sustained under normal conditions. CFA Institute explains the use of normalized earnings per share in this type of analysis.
Differences Between M2, TGA, and Reverse Repos
These three indicators cover different pools of money. M2 is a monetary measure that includes cash and deposits. TGA is the U.S. government's general account at the Federal Reserve. Reverse repos refer to short-term transactions that financial institutions and others conduct with the Federal Reserve.
The components of M2 in South Korea and the United States are not identical. The Bank of Korea and the Federal Reserve provide definitions in their respective statistics. When comparing countries, also use the same basis for growth rates. Bank of Korea's Explanation of M2, Federal Reserve H.6 Money Stock Statistics
| Indicator | What it represents | What to check when making investment decisions |
|---|---|---|
| M2 | Money supply, including cash and deposits | Reference month, growth rate, and whether figures are seasonally adjusted |
| TGA | The U.S. government's deposit balance at the Federal Reserve | Tax receipts, Treasury issuance, and government spending |
| ON RRP | Amount placed in the Federal Reserve's overnight reverse repo facility | Short-term interest rates and yields on other short-term instruments |
| Bank reserves | Deposits that banks hold at the Federal Reserve | Changes occurring alongside movements in TGA and reverse repos |
Does an Increase in M2 Mean Money Is Entering the Stock Market?
An increase in M2 does not directly show the amount of stock purchases. That is because an increase in deposits can be included in money supply growth. The absolute size of the money supply should be distinguished from money flowing into the stock market. M2 growth alone also cannot tell you when stock prices will rebound.
M2 statistics are released monthly. Describing M2 as setting new highs every day therefore does not match its release frequency. To determine whether it is at a record high, compare it with historical values from the same series.
Is a Large TGA Balance Favorable for Rising Stock Prices?
The TGA balance alone cannot determine the direction of the stock market. Government spending can increase bank reserves, all else being equal. Conversely, tax payments and Treasury issuance can reduce reserves. The Federal Reserve Bank of St. Louis explains these relationships between accounts. Explanation of the Federal Reserve's Balance Sheet and Reserves
Money in the TGA is used for government spending and cash management. There is no basis for classifying that balance as money waiting to buy stocks. Where the money goes after it is spent must also be checked separately.
Does a Decline in Reverse Repos Mean Tightening Has Ended?
A decline in reverse repo usage alone does not establish that tightening has ended. The Federal Reserve describes ON RRP as a supplementary tool for managing short-term interest rates. These transactions change the composition of the Federal Reserve's liabilities. They do not directly change the size of its securities holdings. Federal Reserve's Explanation of ON RRP
Money leaving reverse repos can move into Treasury bills and other instruments. The Federal Reserve's 2025 analysis also confirmed such shifts. The entire decline in the balance should therefore not be counted as money flowing into the stock market. Federal Reserve Analysis of MMF Asset Allocation
Comparing Semiconductors, Renewable Energy, and Telecommunications Infrastructure
To assess whether a company benefits from increased AI investment, check whether that investment translates into revenue for the company. Even companies in the same industry have different customers and contract structures. The table below provides criteria for review, not a ranking of stocks to buy.
| Sector | Conditions for expectations to translate into revenue | Information to check | Conditions that weaken expectations |
|---|---|---|---|
| Semiconductors | Customer adoption and increased shipments | Revenue by product, production plans, and customer demand | Falling selling prices, increased supply, and reduced customer investment |
| Wind and solar power | Orders and deliveries for power generation projects | Order backlog, contract terms, and profitability by project | Permitting delays, rising financing costs, and contract changes |
| Power infrastructure | Grid connections and equipment installation | Delivery schedules, orders, and capacity expansion plans | Grid connection delays and project cancellations |
| Data center networking equipment | Actual adoption of the relevant equipment | Product uses, customer mix, and order details | Adoption of other technologies and delayed customer investment |
| Telecommunications services and mobile network equipment | Investment and demand from the relevant operators | Results by business and capital expenditure plans | Reduced investment and increased competition |
The IEA recorded 17% growth in global data center electricity demand in 2025. The figure appears in its 2026 report. It supports the case for expanding electricity demand. It does not represent the earnings growth rate of any individual renewable energy company. IEA's Key Questions on Energy and AI
Supplying electricity requires grids and storage systems as well as generation facilities. The IEA identifies grid connection delays as a constraint. When reviewing a renewable energy company, check which projects it supplies. Distinguish contracts linked to data center demand from those that are not.
Telecommunications infrastructure also needs to be separated by business area. Data center networking equipment and mobile network equipment serve different sources of demand. Samsung Electronics reported a decline in its networks business results for the third quarter of 2026. This shows why a semiconductor boom cannot be assumed to extend to every telecommunications business.