Infographics
A collection of infographics that pack information into a single image. Click an image to enlarge it.
No infographics are available in the current language, so infographics in all languages are shown.
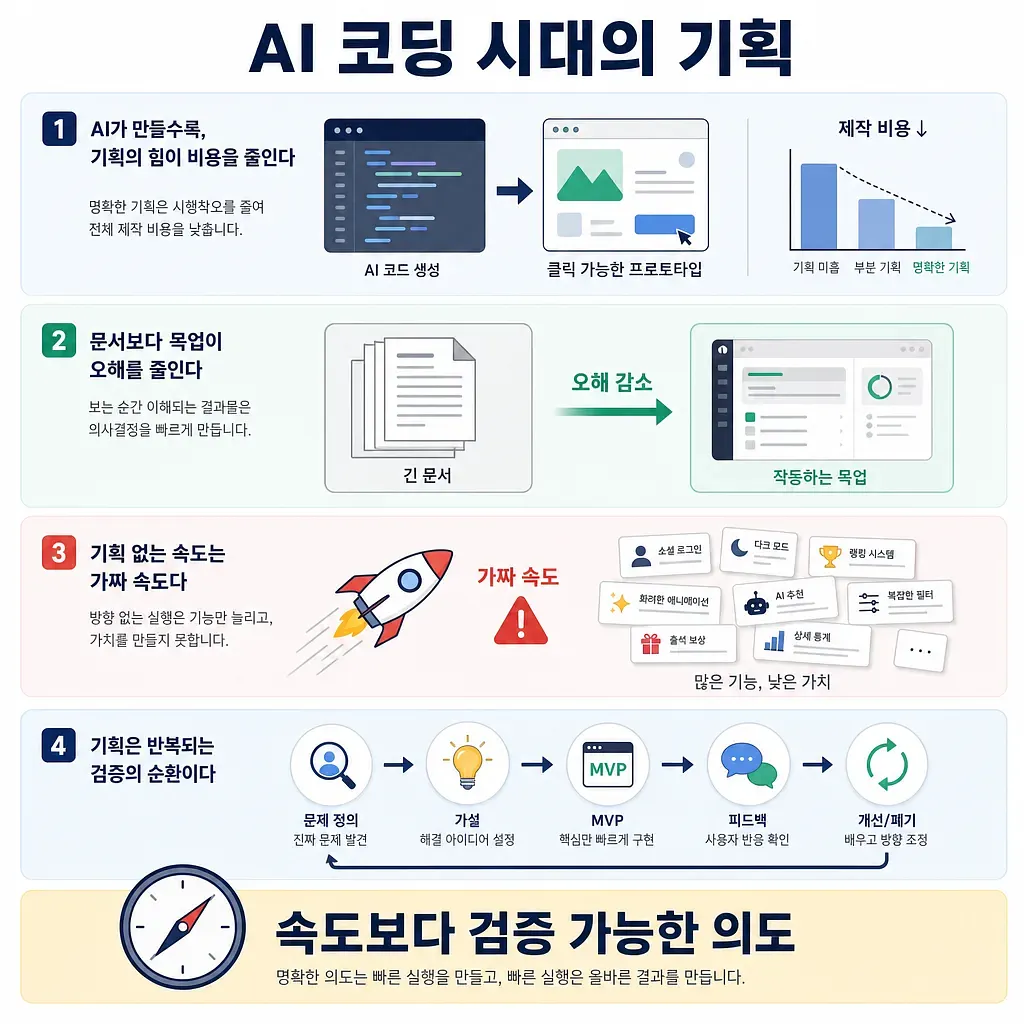
The infographic shows why clear planning and repeated validation matter more than speed in AI coding.
Why Planning Remains Crucial in the Age of AI Coding: Verifiable Intent Over False Speed
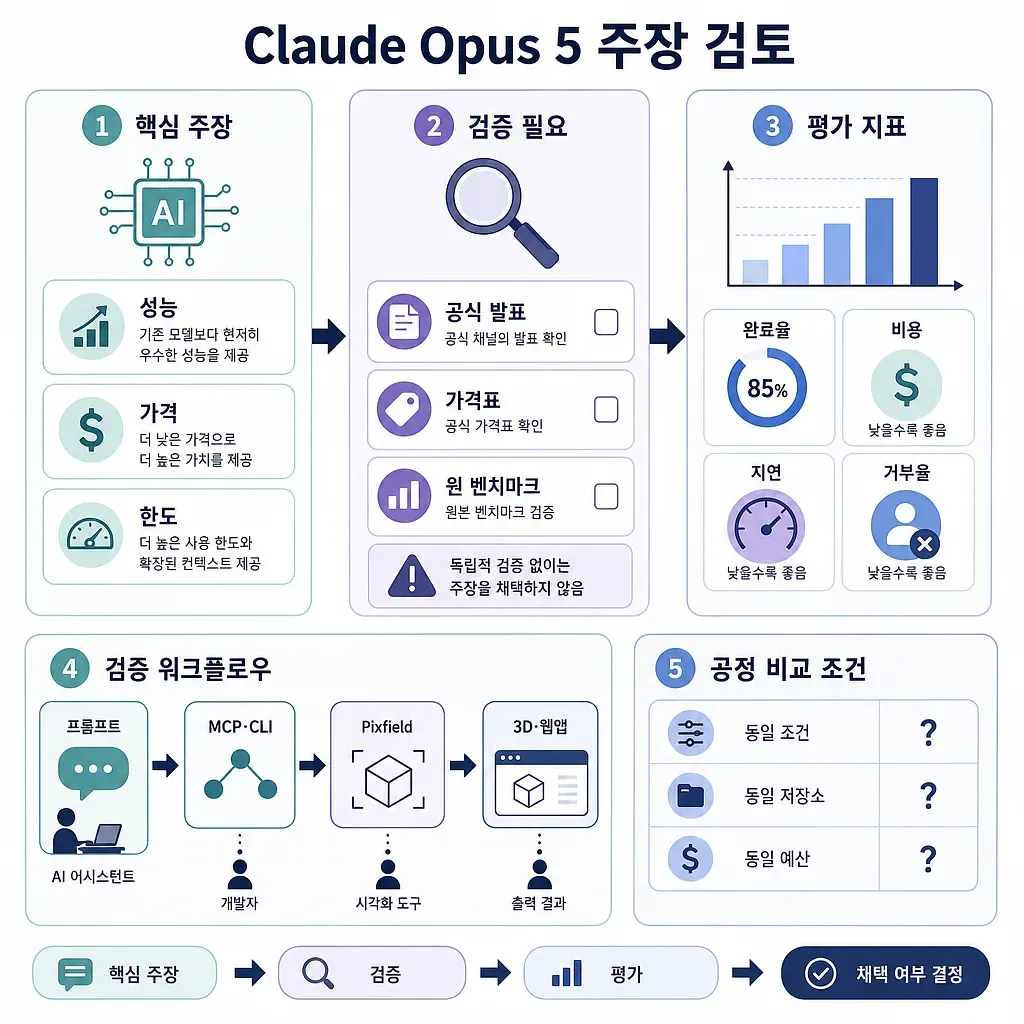
The graphic shows key claims, verification checks, metrics, workflow, and fair comparison conditions.
Claude Review of the Opus 5’s Performance, Price, and Claimed Pixfield Integration
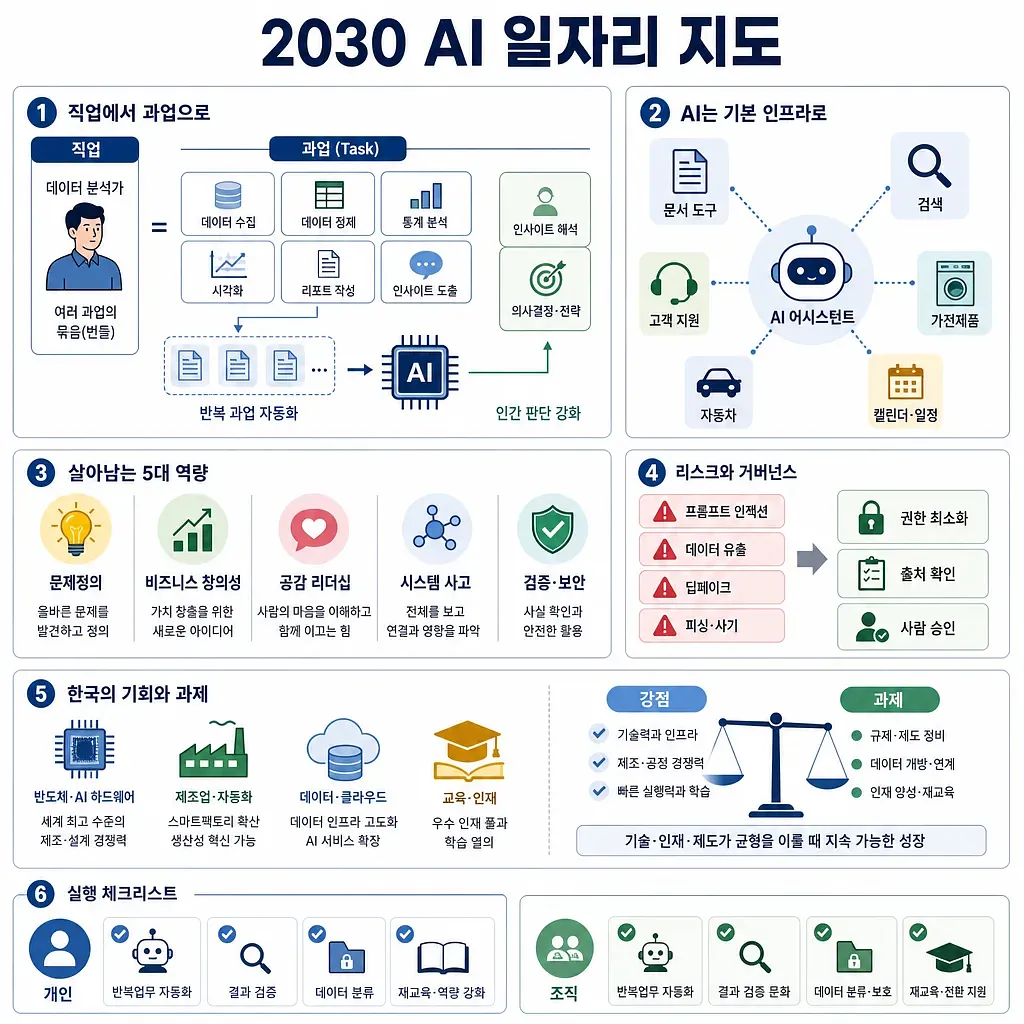
The chart summarizes how jobs, skills, governance, and Korea’s opportunities may shift in the AI era.
The AI Era of 2030: How Will Jobs Change, and What Skills Will Endure?
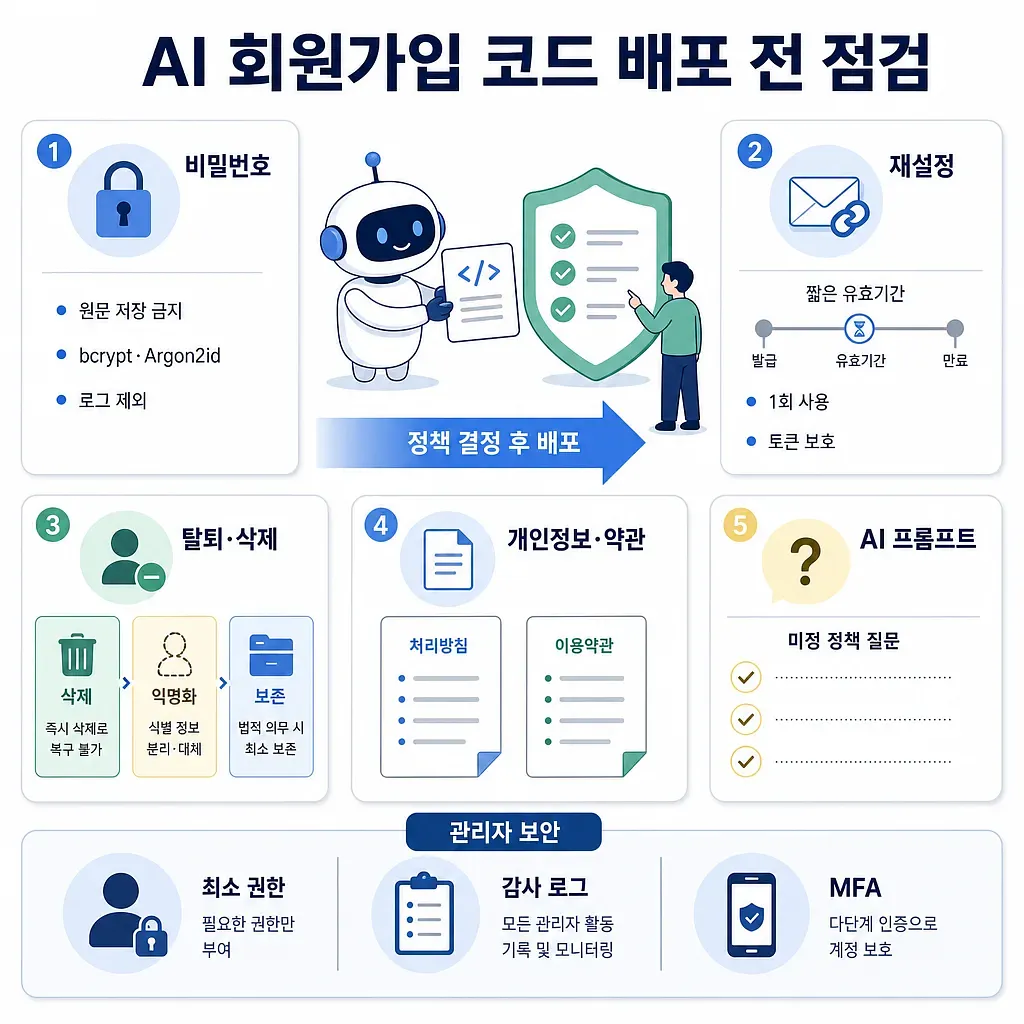
The infographic summarizes security and legal checks before deploying AI-generated signup code.
Security and Legal Policies for Reviewing AI-Generated Registration Codes Before Implementing Them in a Service
The graphic explains how Korea’s geography and climate shaped cultural resilience.
Where Does the Resilience of Koreans Come From? A Look at Cultural Traits Through the Geography and Climate of the Korean Peninsula

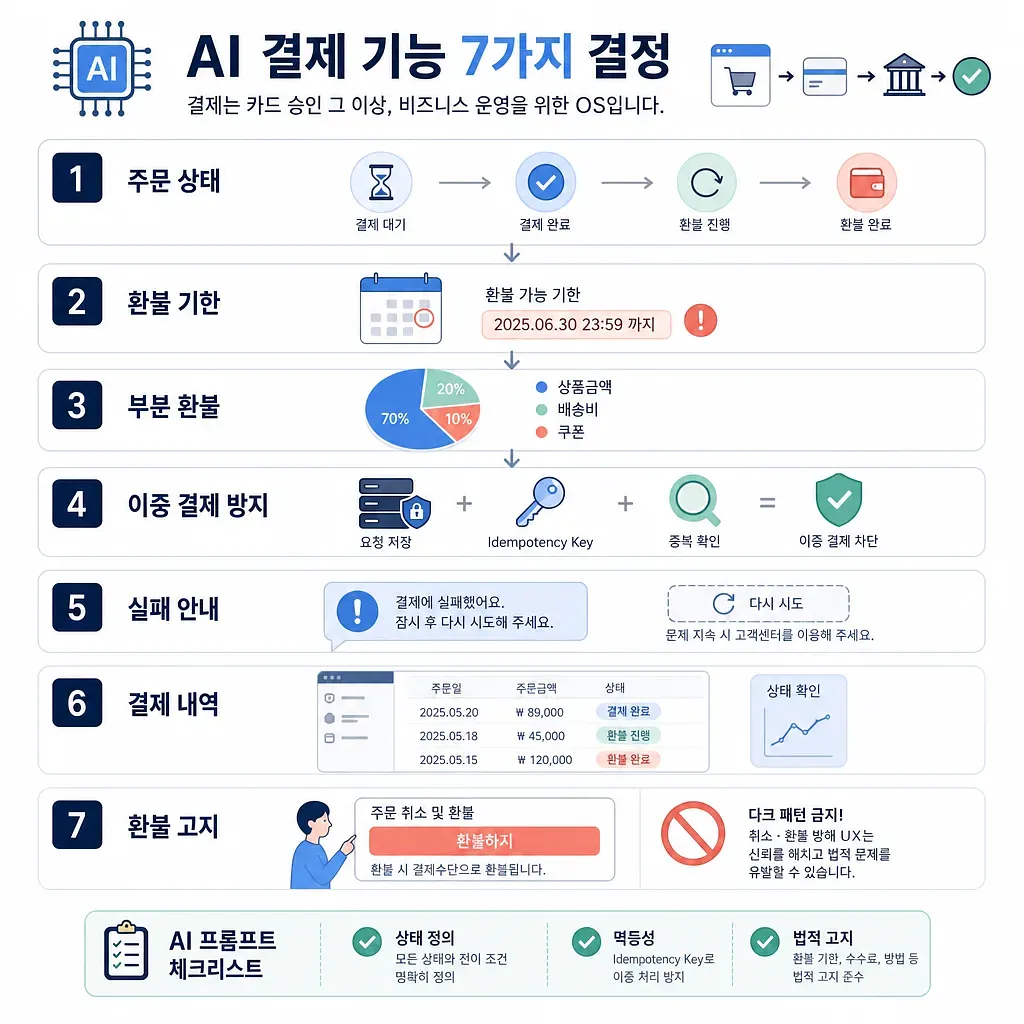
The graphic summarizes key payment feature choices such as status, refunds, and duplicate prevention.
7 Things to Decide First When Building an AI-Powered Payment Feature
The graphic summarizes Anthropic’s move from past criticism to recognition amid frontier AI competition.
Elon Musk's Changing View of Anthropic: From Criticism to Recognition of Its Technical Capabilities

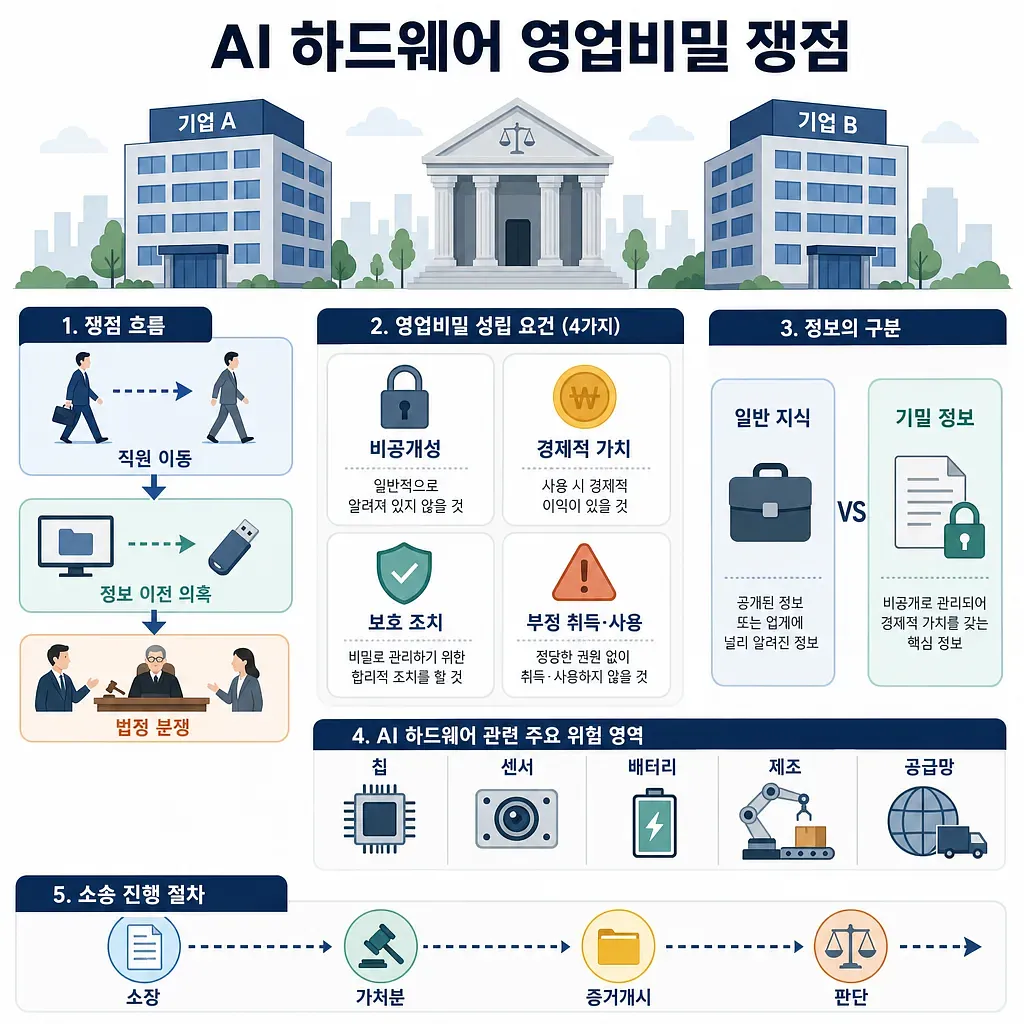
The graphic summarizes the flow, legal elements, and risk areas of an AI hardware trade secret dispute.
Apple Takes OpenAI to Court Over Trade Secret Dispute
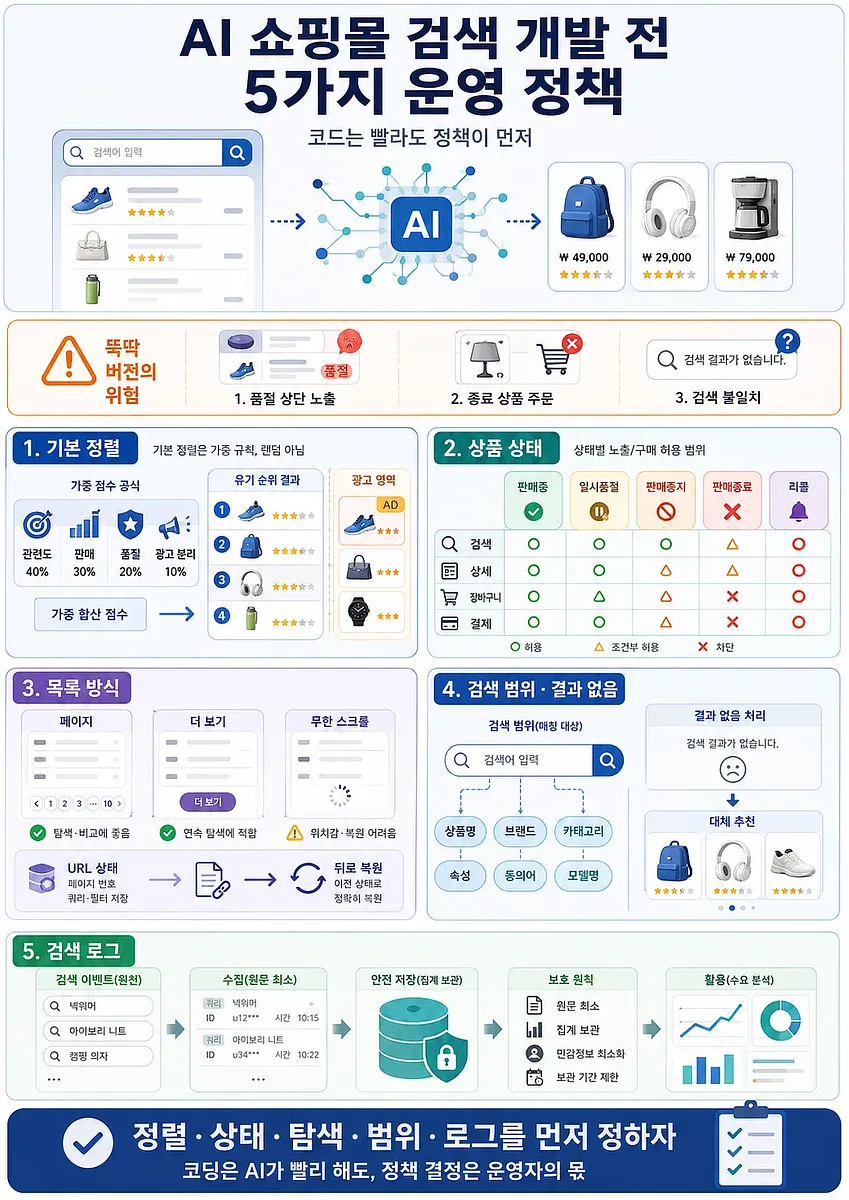
The infographic presents five operating policies to define before developing AI-powered e-commerce search and highlights common implementation risks.
5 Operational Policies to Establish Before Developing an AI-Powered E-Commerce Search Engine
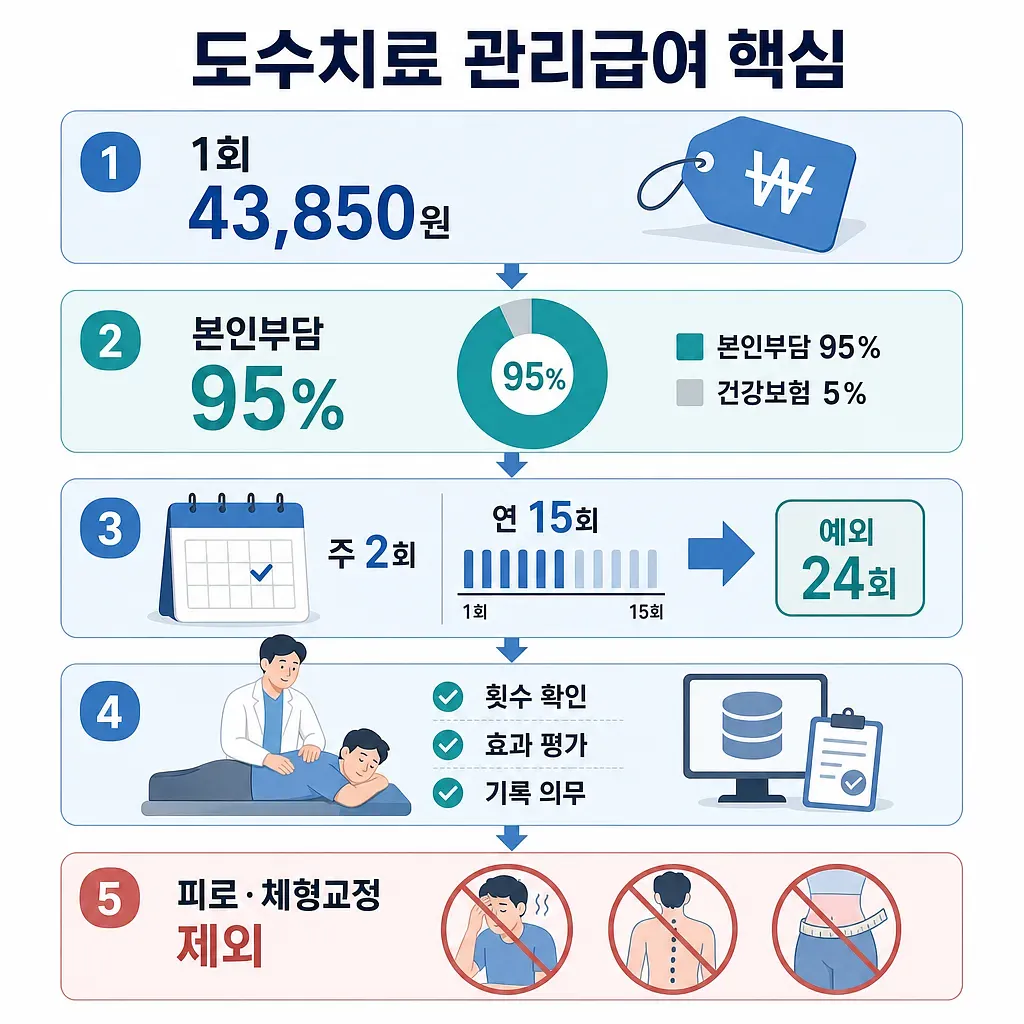
The graphic outlines the fee, 95% patient payment, annual visit limits, and excluded uses for manual therapy.
Implementation of Managed Care Benefits for Manual Therapy: 43,850 won per session; Summary Based on 15 Sessions Per Year
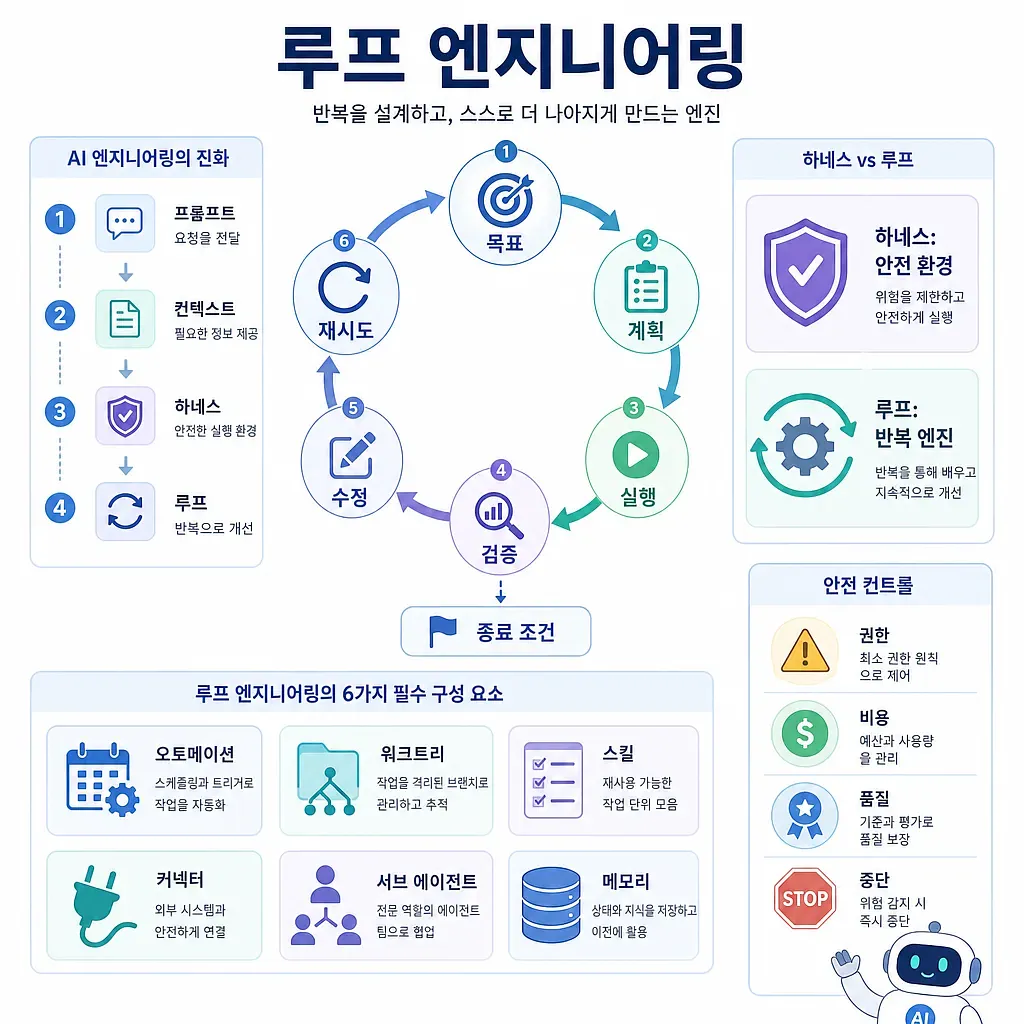
The diagram summarizes the loop engineering cycle from goals to retry, with controls and key components.
The Concept and Essential Components of Loop Engineering
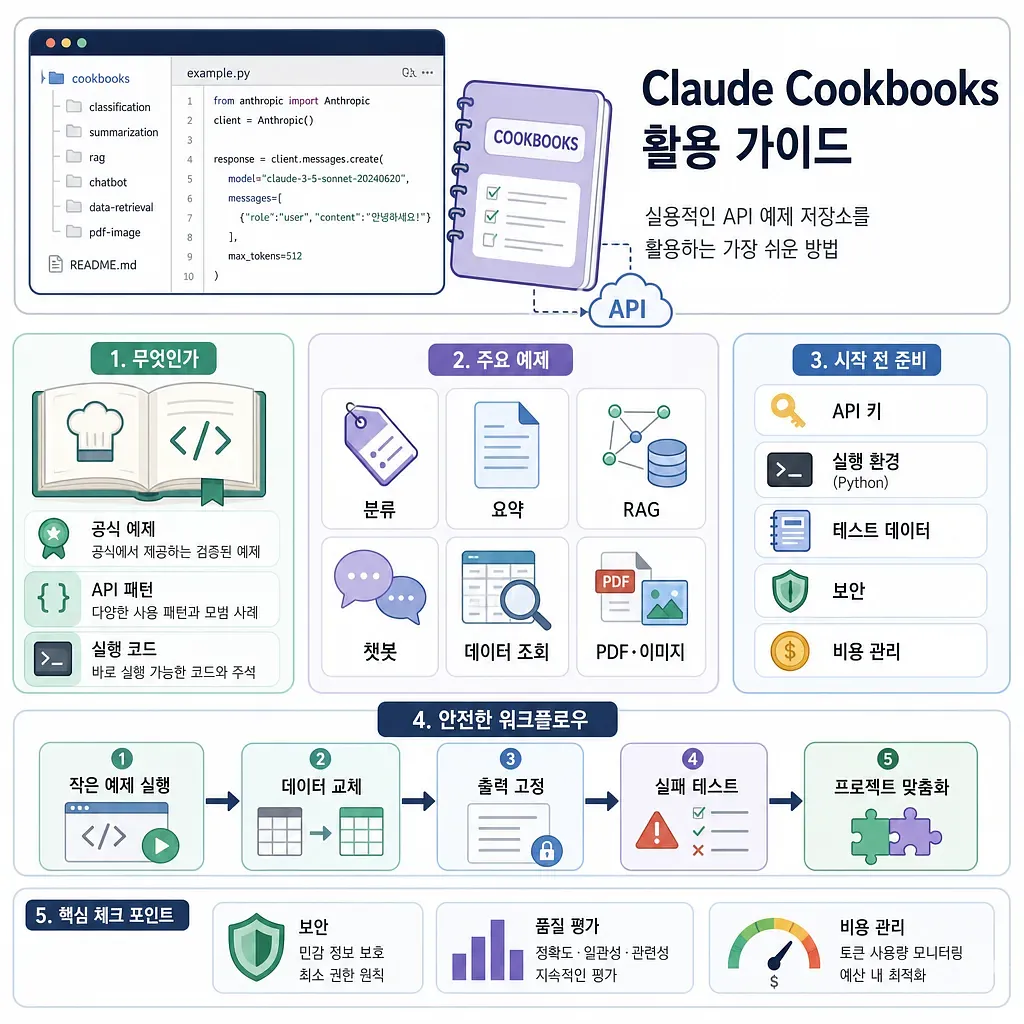
The graphic summarizes practical Claude API examples, setup needs, and safe workflow tips.
Claude Cookbooks: Official GitHub Resources for Quickly Following Along with Practical INJX12 API Examples
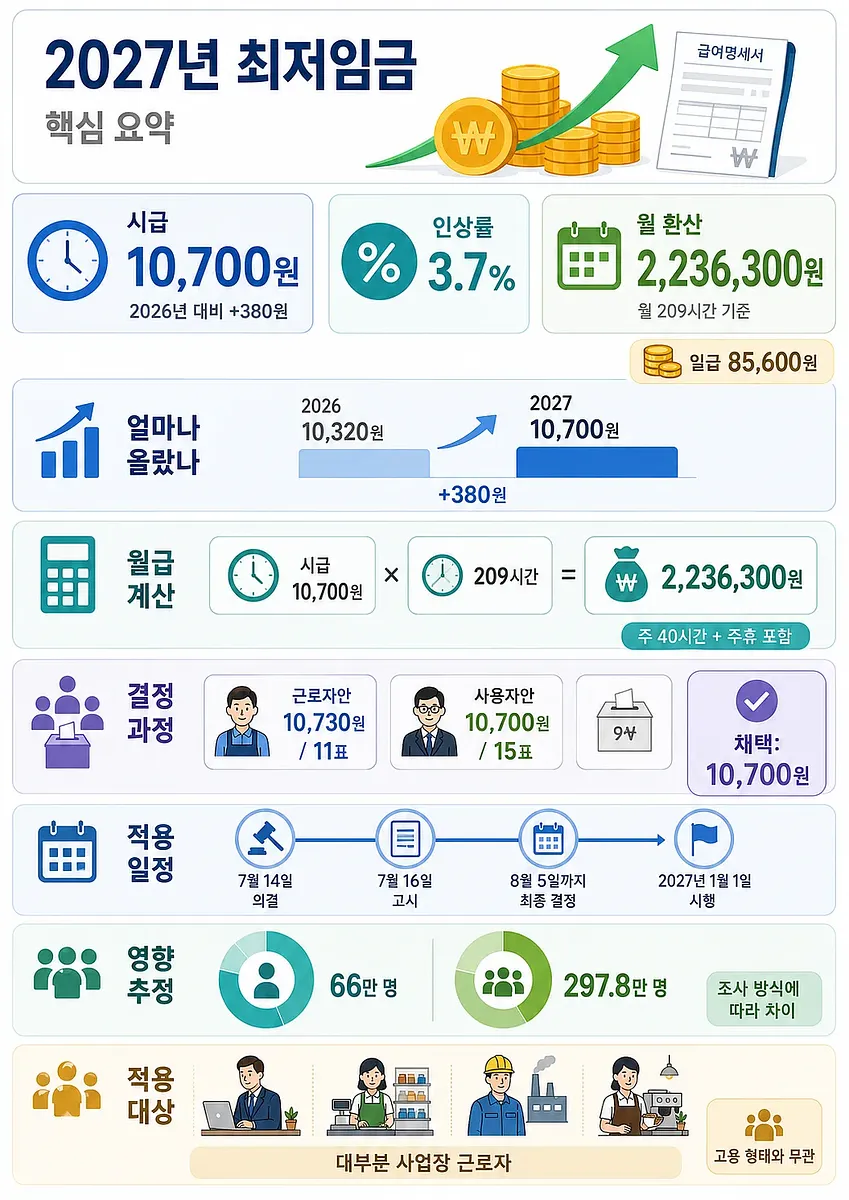
This infographic brings together the proposed 2027 minimum wage, salary conversion, voting result, and rollout schedule.
2027 Minimum Wage of 10,700 Won: Monthly Salary Conversion and Implementation Schedule
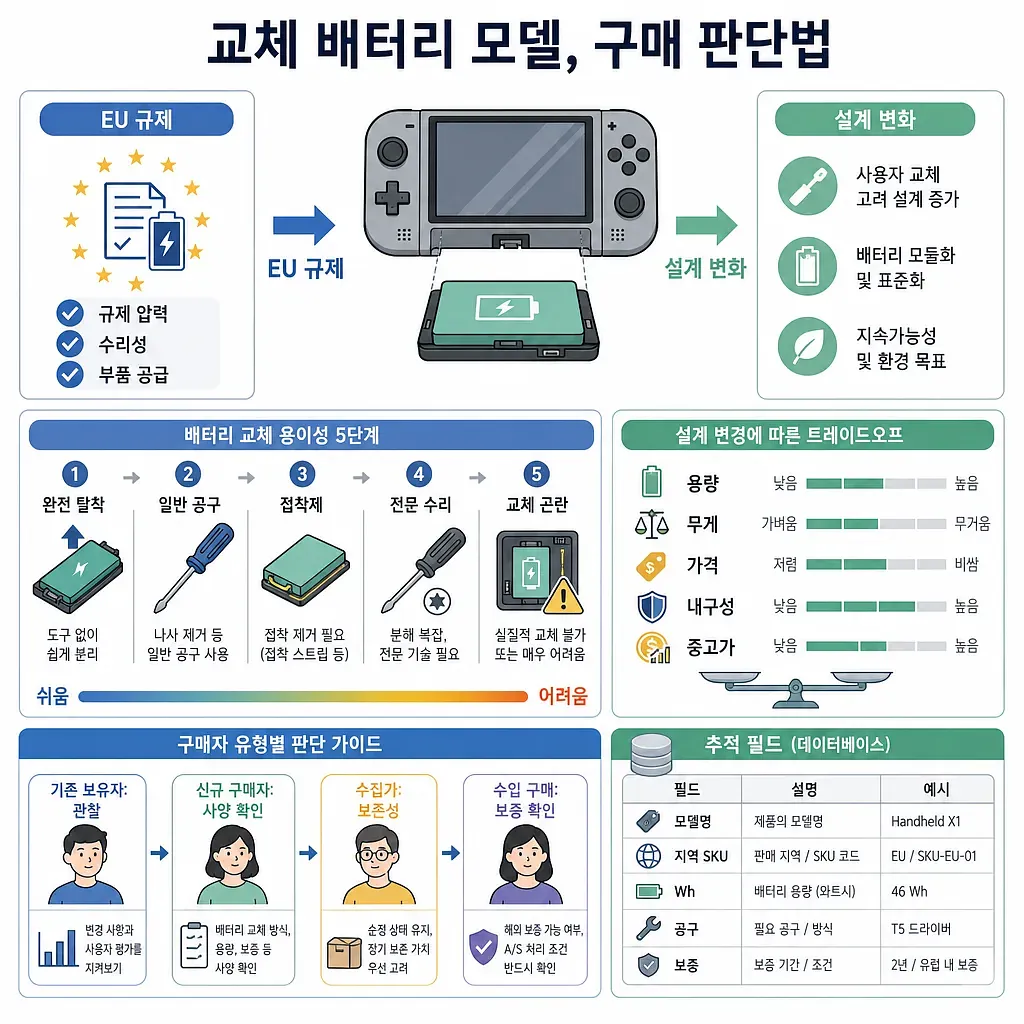
The graphic outlines how EU rules and battery replaceability affect Switch 2 purchase decisions.
The Switch 2 "User-Replaceable Battery" Model and How EU Regulations Are Shaping Purchasing Decisions
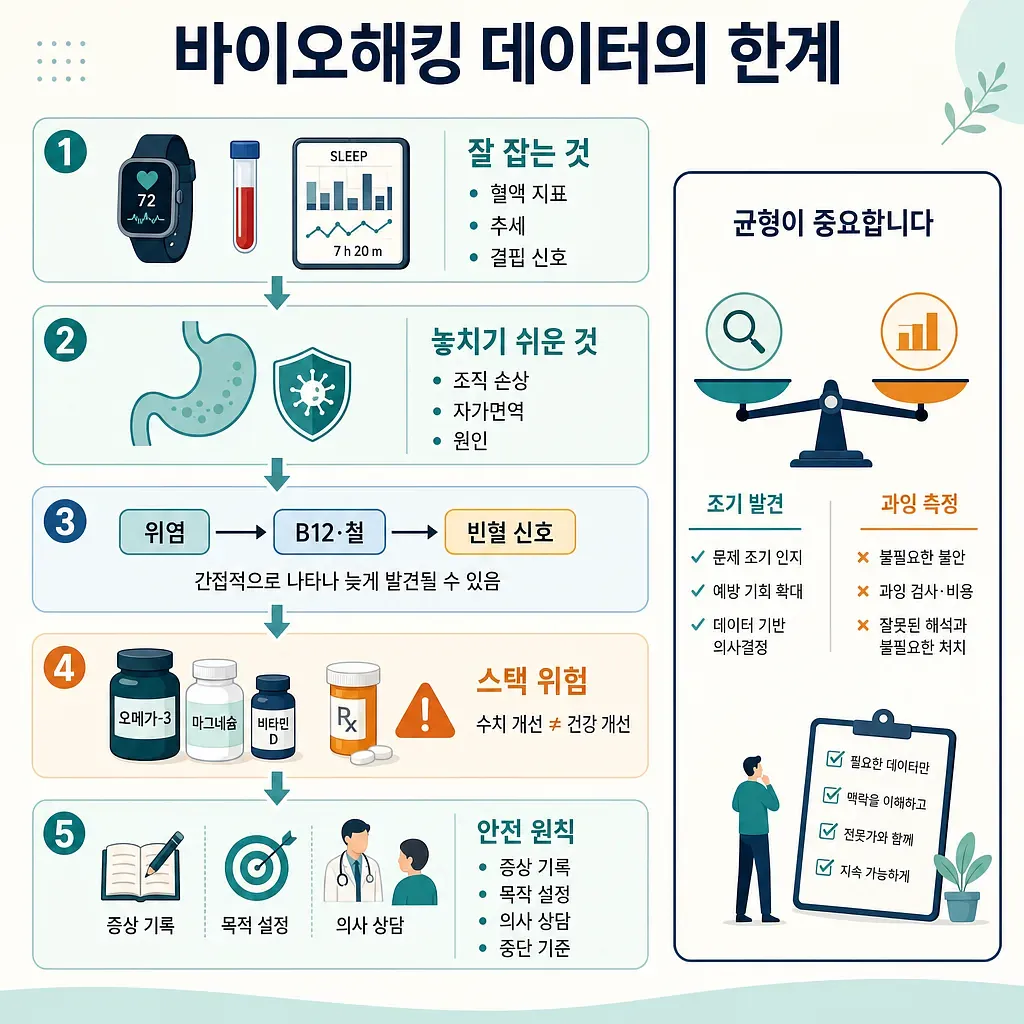
The infographic outlines the benefits and limits of biohacking data, including missed signals, supplement risks, and safety principles.
A Disease Even the “Most Measured Man” Missed: The Limits of Biohacking Data, as Seen Through the Brian Johnson Controversy
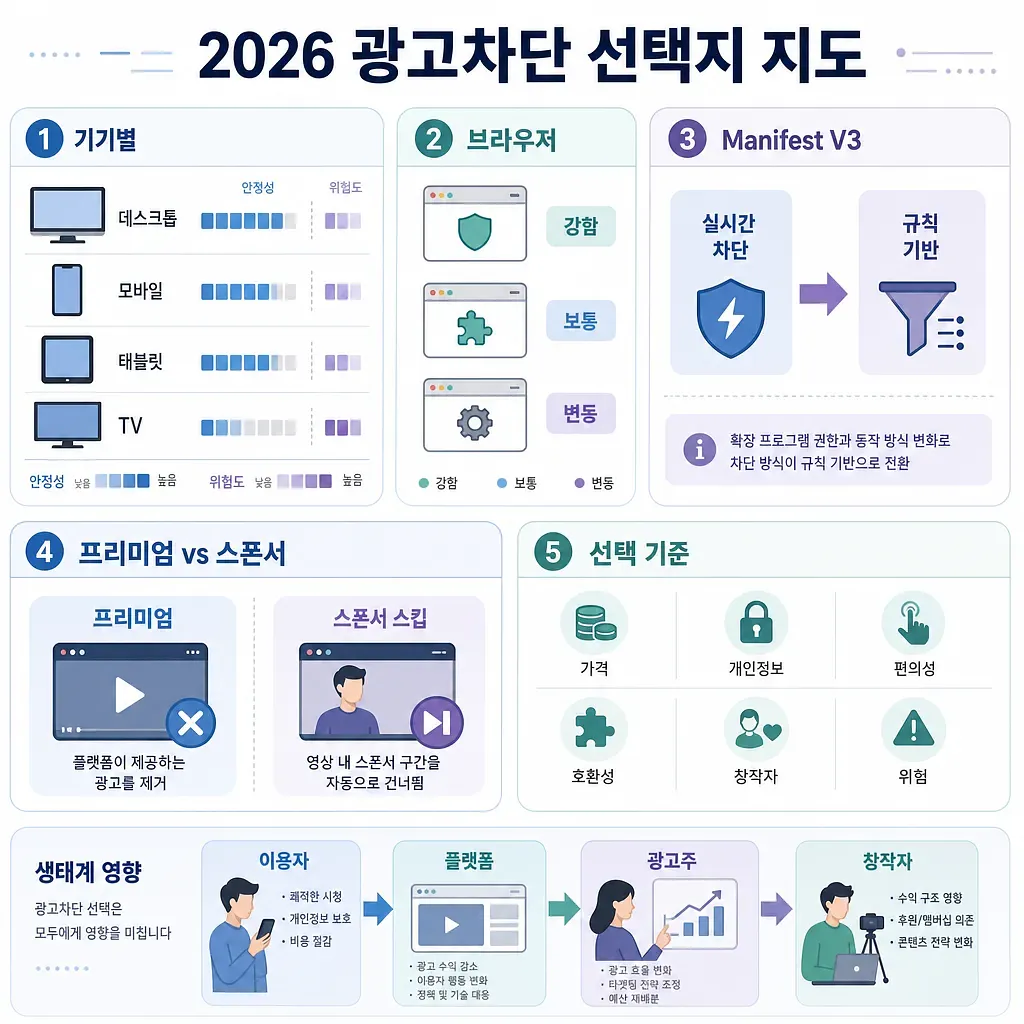
The graphic maps YouTube ad-blocking choices in 2026 across devices, browsers, policy shifts, and trade-offs.
The YouTube Ad-Blocking War of 2026: A Guide to DuckDuckGo, uBlock, and Premium Options
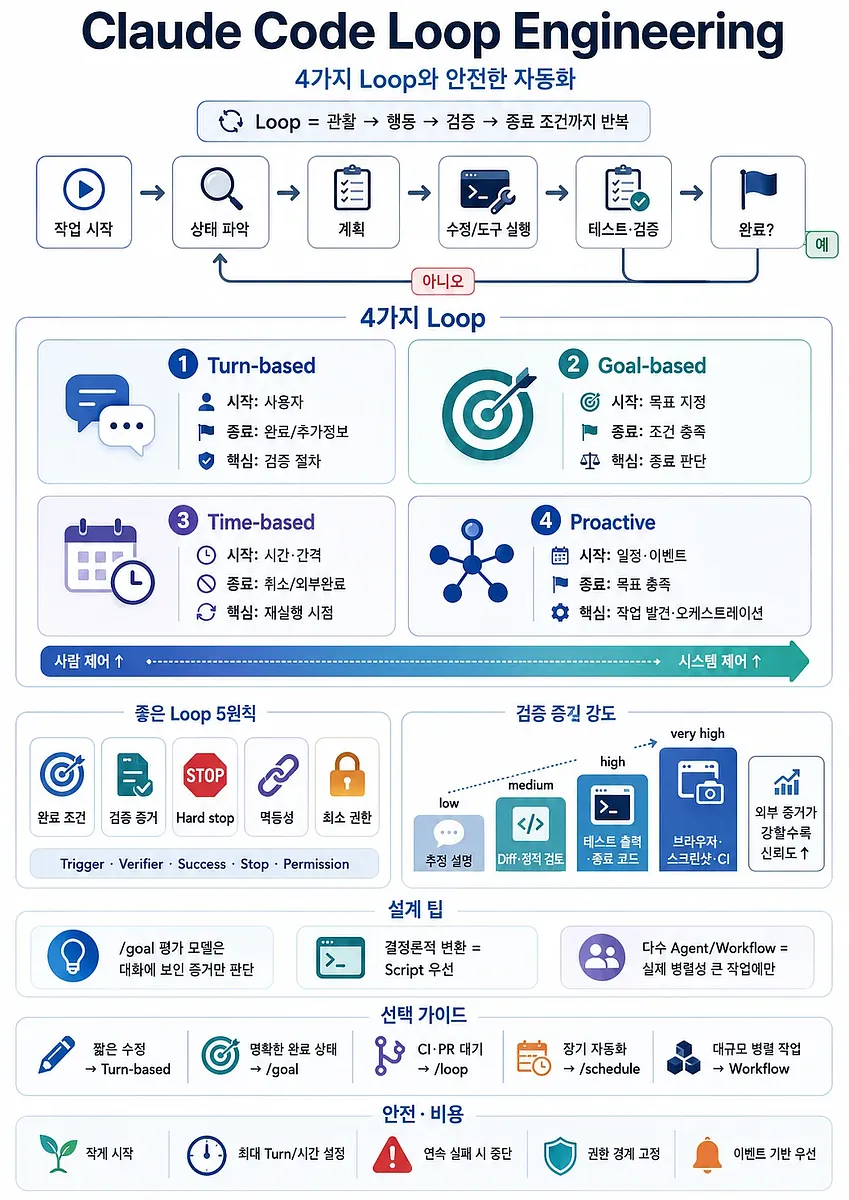
It summarizes the observe-act-verify cycle and safe design principles for four Claude Code loop types.
Claude Code Loop Engineering Guide: 4 Types of Loops and Safe Automation Design
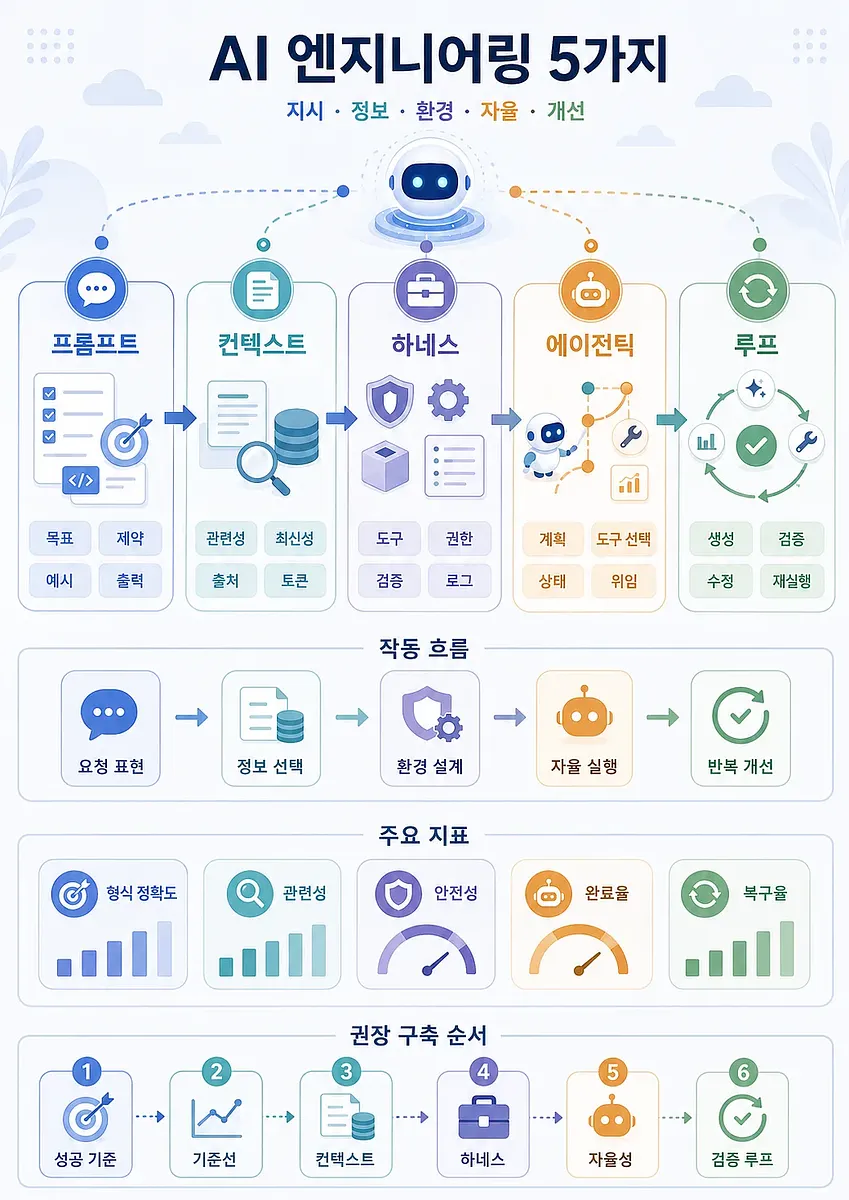
The infographic summarizes how five AI engineering approaches connect, operate, and improve system quality.
Differences and Design Methods for Prompts, Context, Harnesses, Agentics, and Loop Engineering
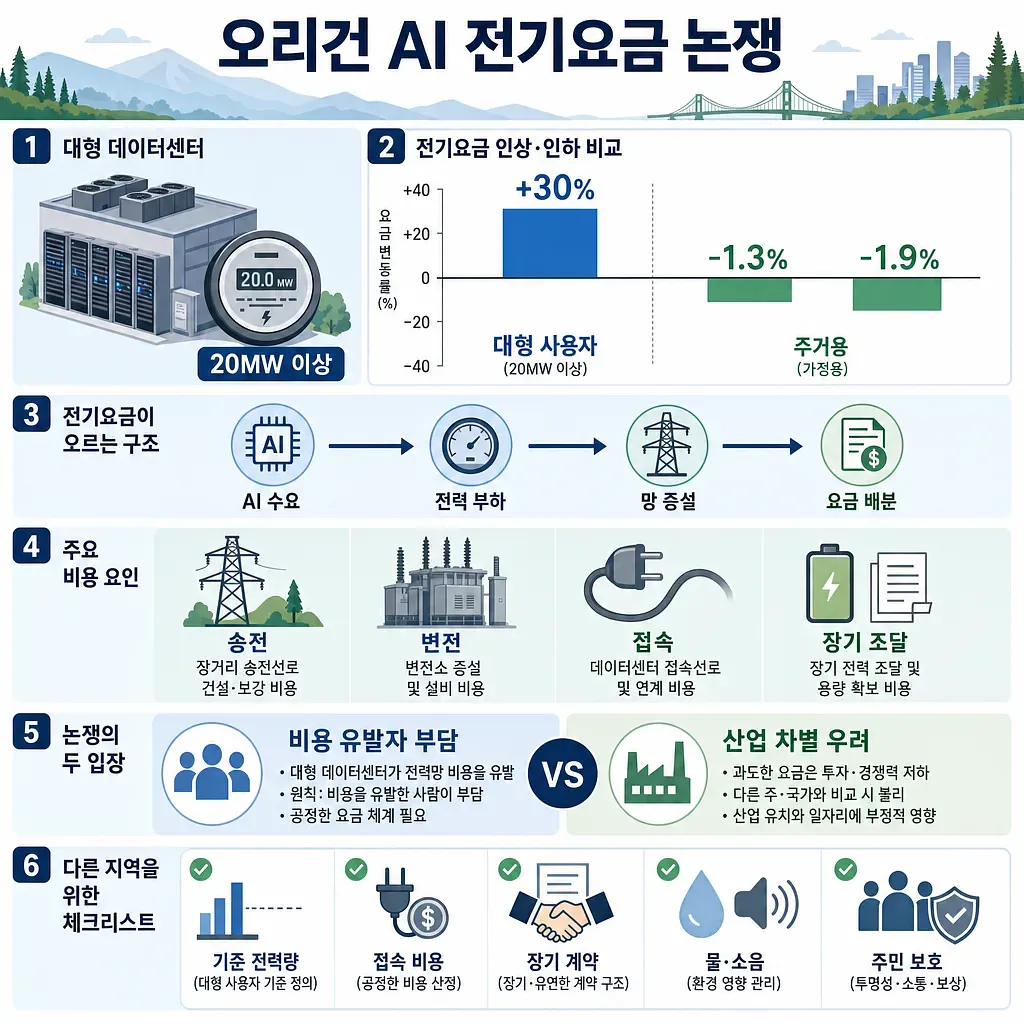
The graphic summarizes large data-center demand, rate changes, grid costs, stakeholder positions and policy checks.
Oregon AI Data Center Electricity Bill Debate: Cost Dataset for Large Power Consumers
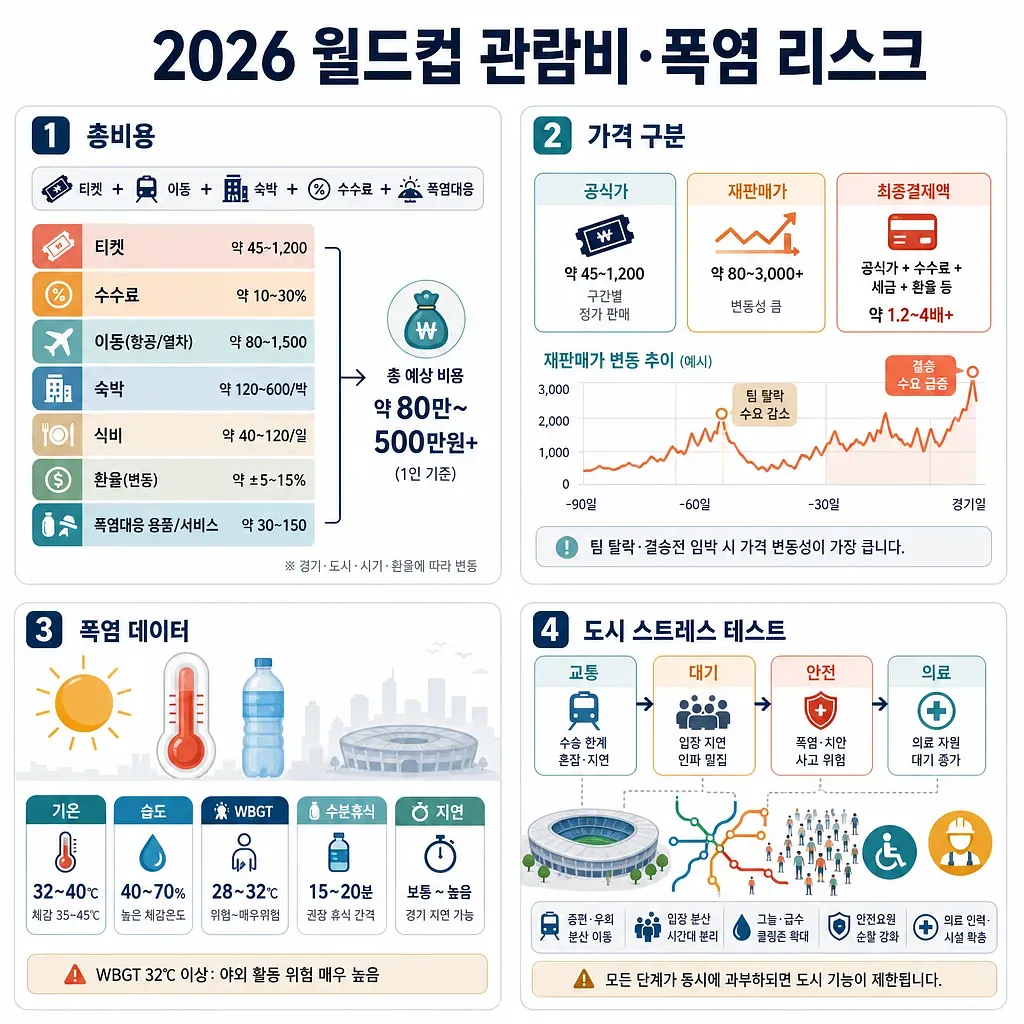
The graphic summarizes expected expenses, resale volatility, heat data, and urban stress factors.
Quantifying the Actual Cost of Attending the 2026 World Cup and the Risks of Extreme Heat
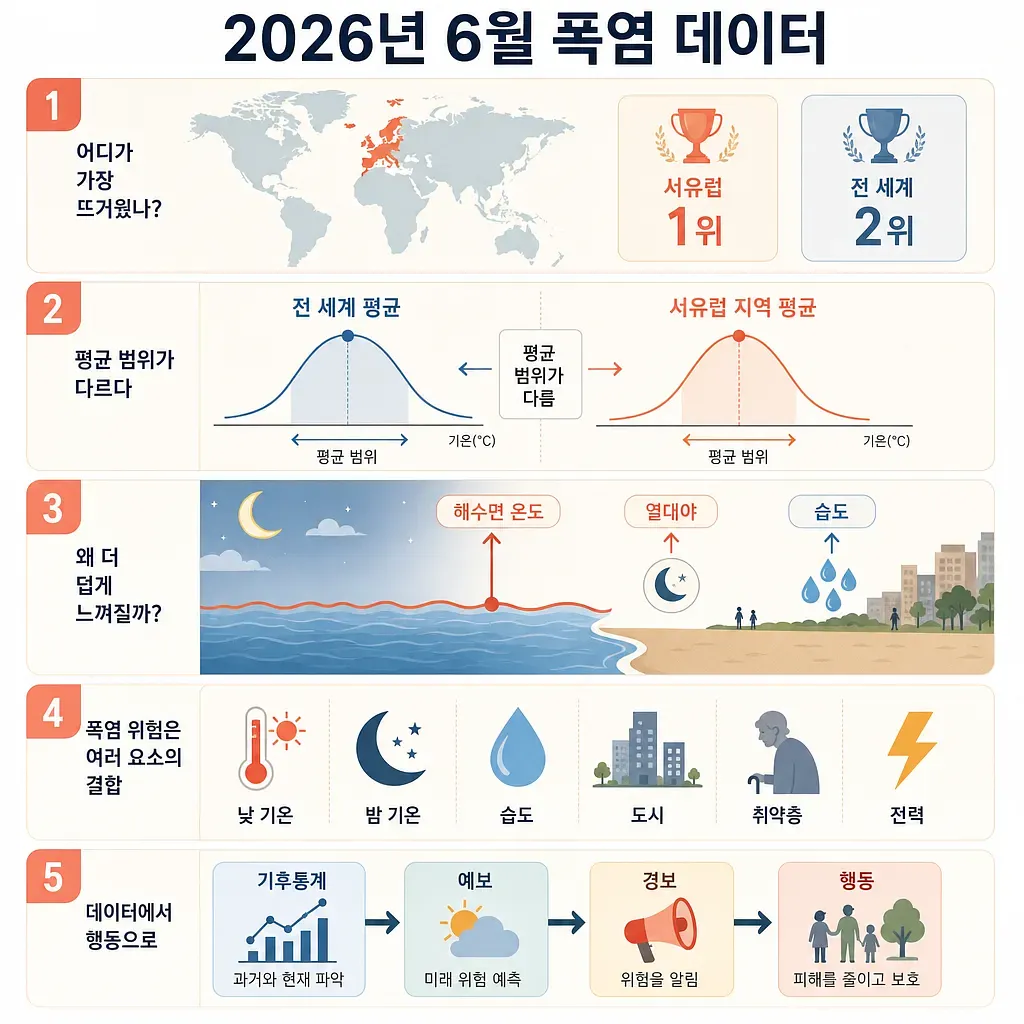
The infographic summarizes heatwave rankings, sea temperature, humidity, and risk factors for June 2026.
Analyzing June 2026 Heat Wave Data: Records in Western Europe, Sea Surface Temperatures, and Heat Wave Alerts in the U.S.
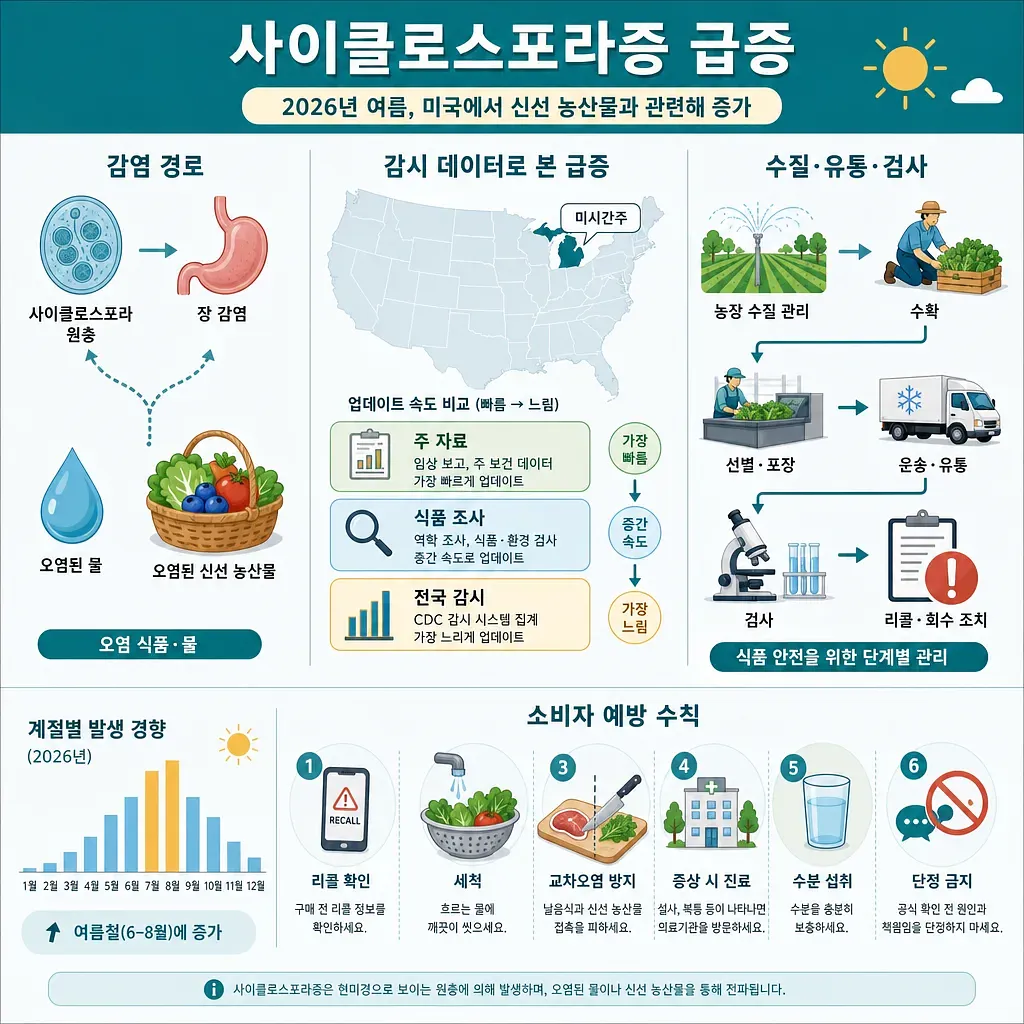
The graphic summarizes U.S. cyclosporiasis risks, surveillance data, food handling steps, and prevention tips.
Surge in Cyclosporiasis in the U.S.: Foodborne Illness Risks as Seen Through Fresh Produce, Surveillance Systems, and State-by-State Data
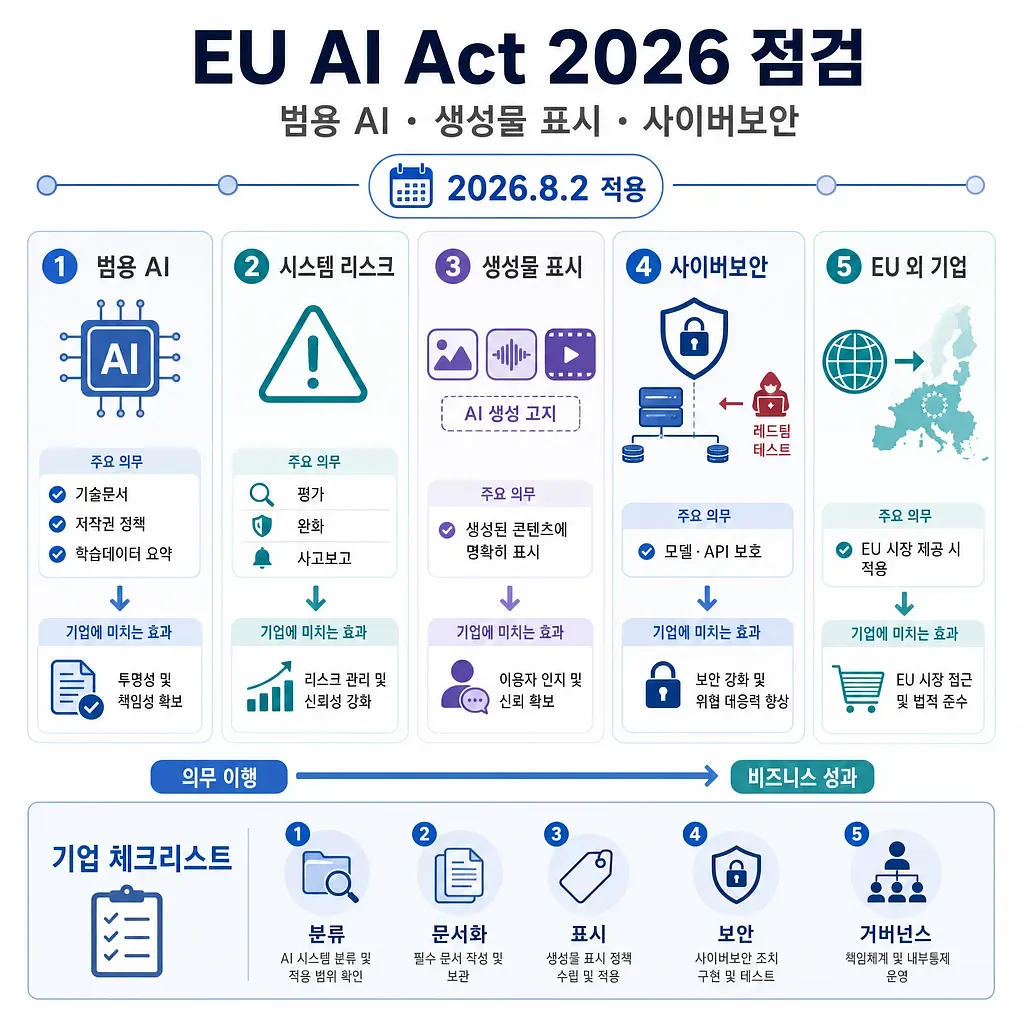
The graphic outlines key EU AI Act obligations and a business checklist before 2 August 2026.
Pre-Implementation Review of the EU AI Act 2026: A Guide to General-Purpose AI, Labeling of Generated Content, and Cybersecurity Obligations
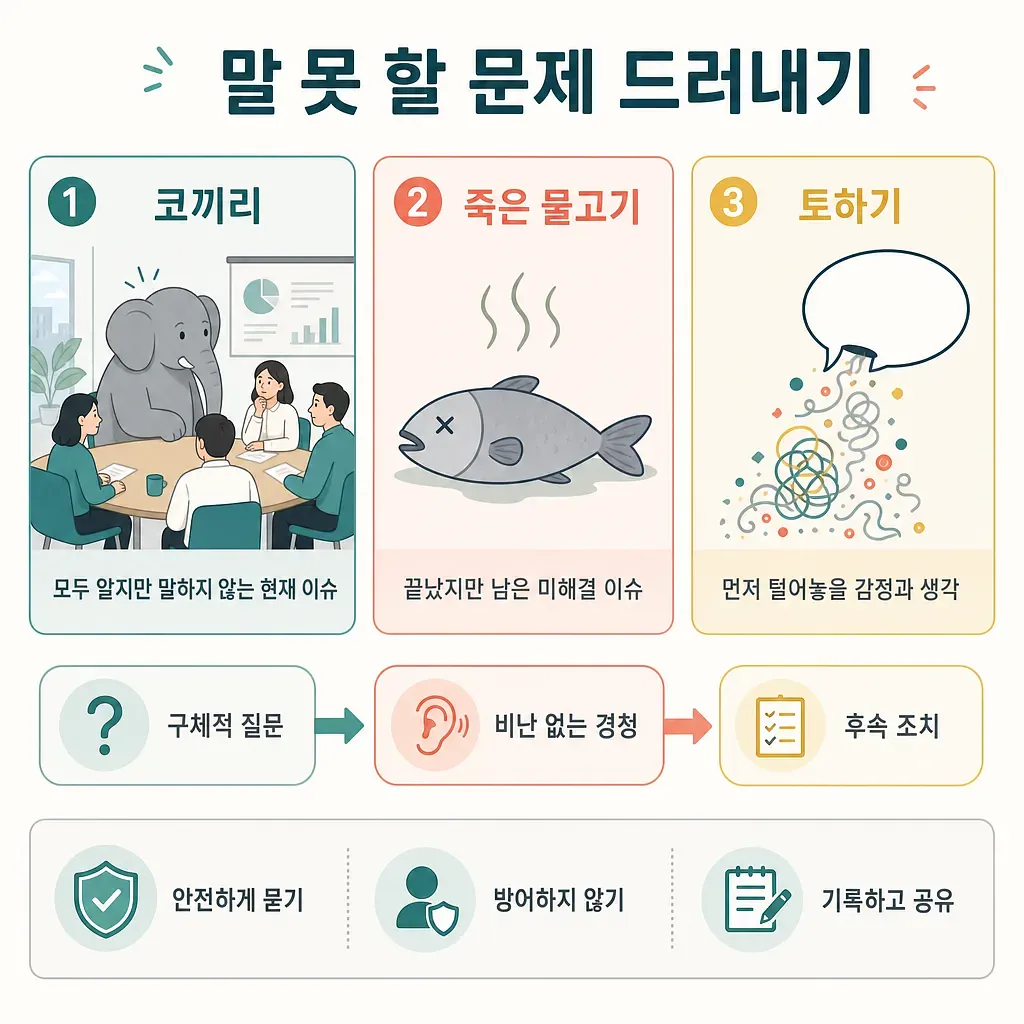
The graphic explains three metaphors for surfacing hidden organizational problems.
How to Bring an Organization’s Unspeakable Problems to Light: Elephants, Dead Fish, and Vomiting
 Injoys