Infographics
A collection of infographics that pack information into a single image. Click an image to enlarge it.
No infographics are available in the current language, so infographics in all languages are shown.
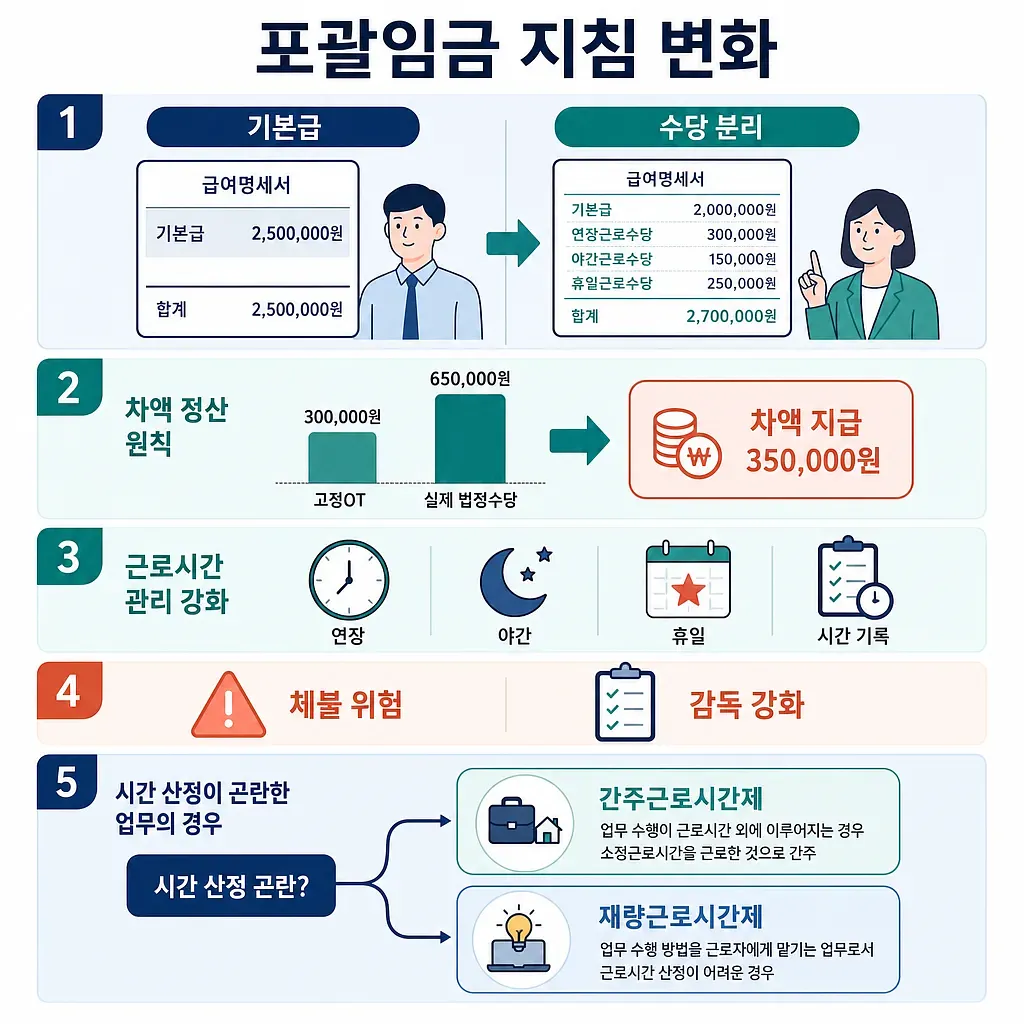
The graphic outlines allowance separation, wage-difference payment, and stricter work-hour records under the new guidance.
Changes to Fixed Overtime and Working Hours Management Standards Following the Implementation of the Comprehensive Wage Guidelines
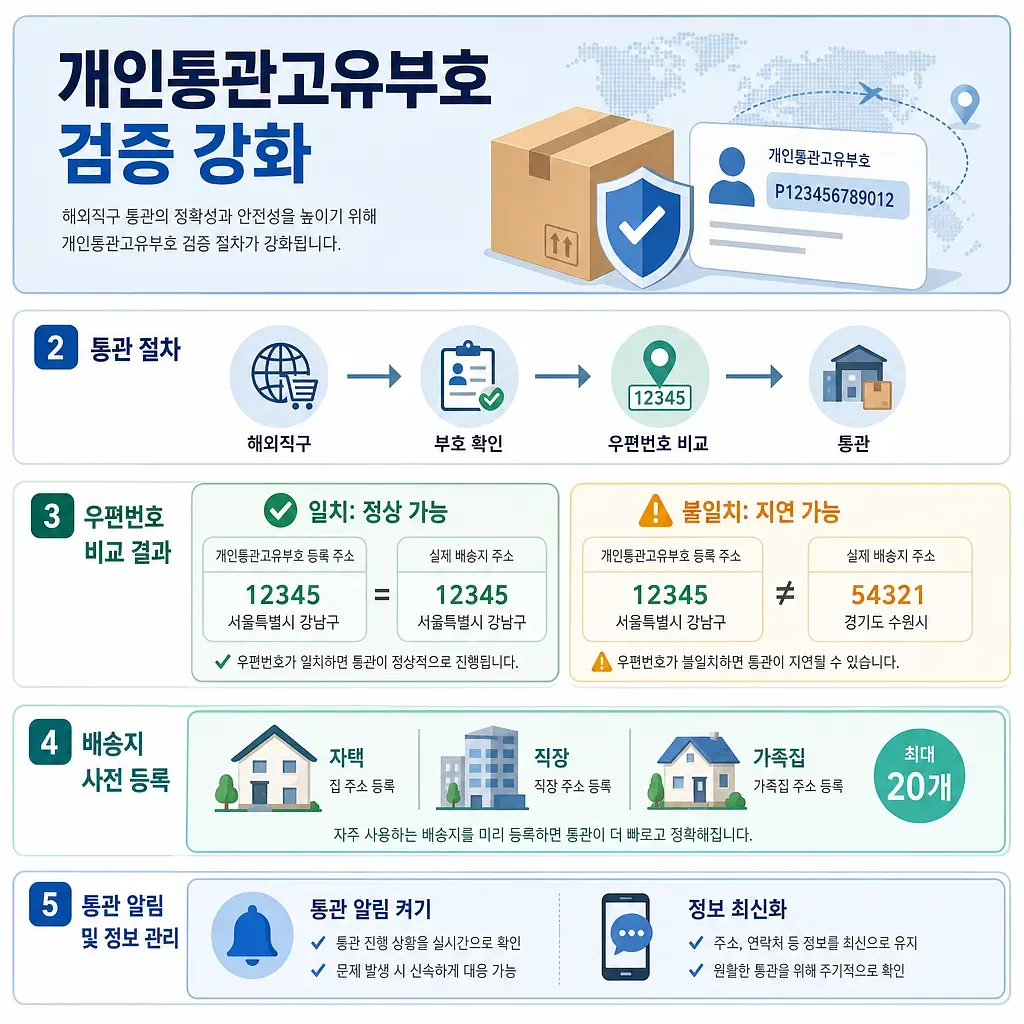
The infographic explains PCCC verification, ZIP code comparison, address preregistration, and customs alerts.
Strengthening Verification of Personal Customs Identification Numbers: How to Verify Your ZIP Code and Register a Shipping Address
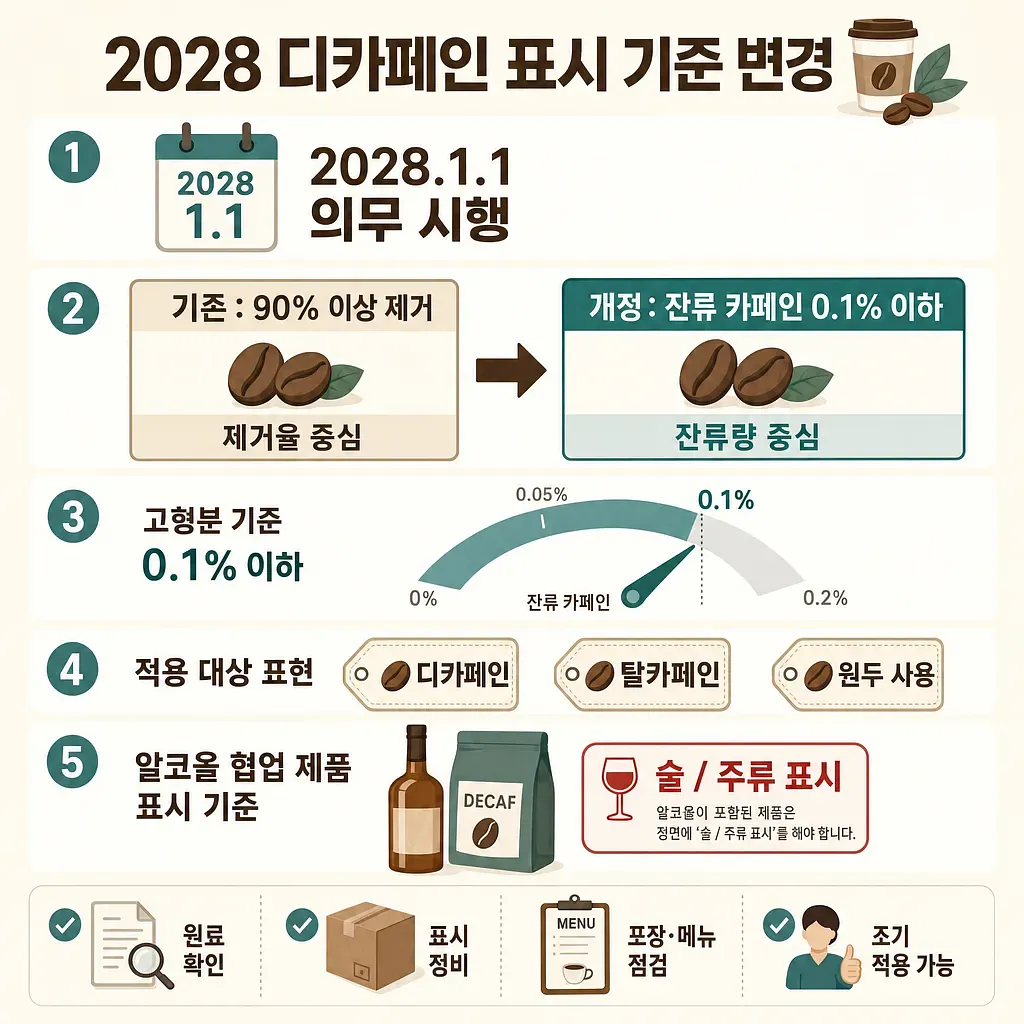
The graphic outlines the 2028 shift to a residual caffeine limit of 0.1% or less for decaf labels.
New Labeling Standards for Decaffeinated Coffee Effective in 2028
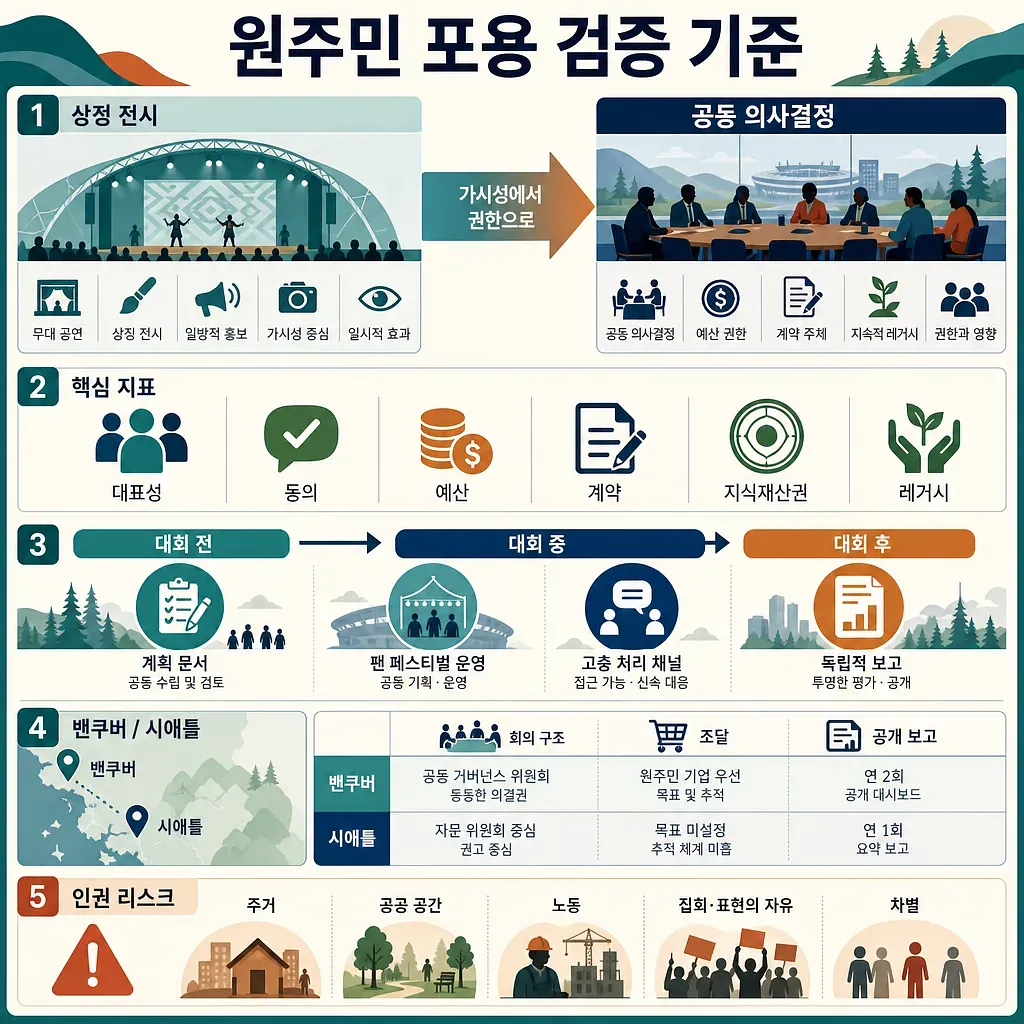
The graphic frames Indigenous inclusion as a shift from symbolic display to shared decision-making.
A Model for Indigenous Inclusion at the 2026 North American World Cup: Evaluation Criteria for Fan Festivals and Human Rights Legacy
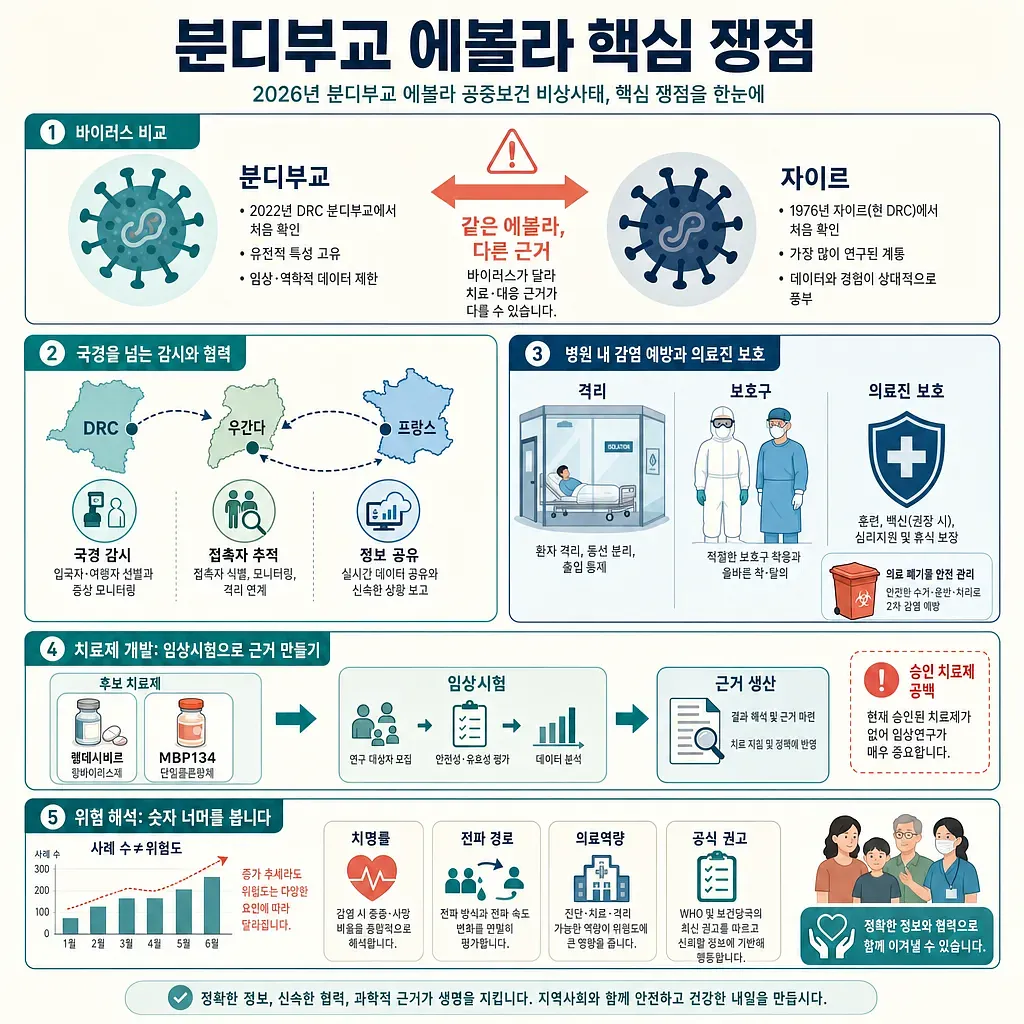
The infographic outlines virus comparison, cross-border surveillance, hospital infection control, and treatment trials.
The Spread of Ebola in Bundibugyo and Clinical Trials of Antiviral Drugs: Key Issues in the 2026 Public Health Emergency
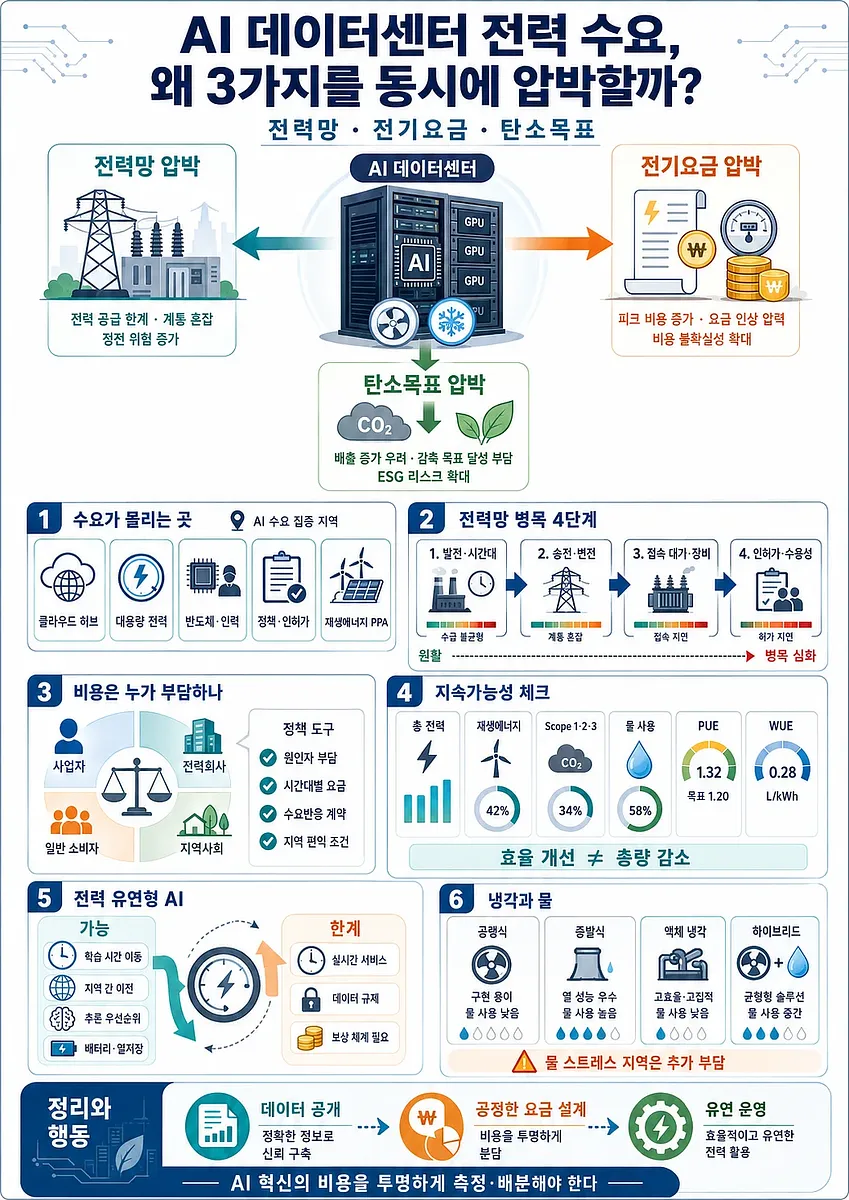
The infographic organizes how AI data centers affect grid bottlenecks, cost sharing, sustainability metrics, and flexible power-aware operations.
Why AI Data Center Power Demand Is Putting Pressure on the Power Grid, Electricity Rates, and Carbon Reduction Targets All at Once
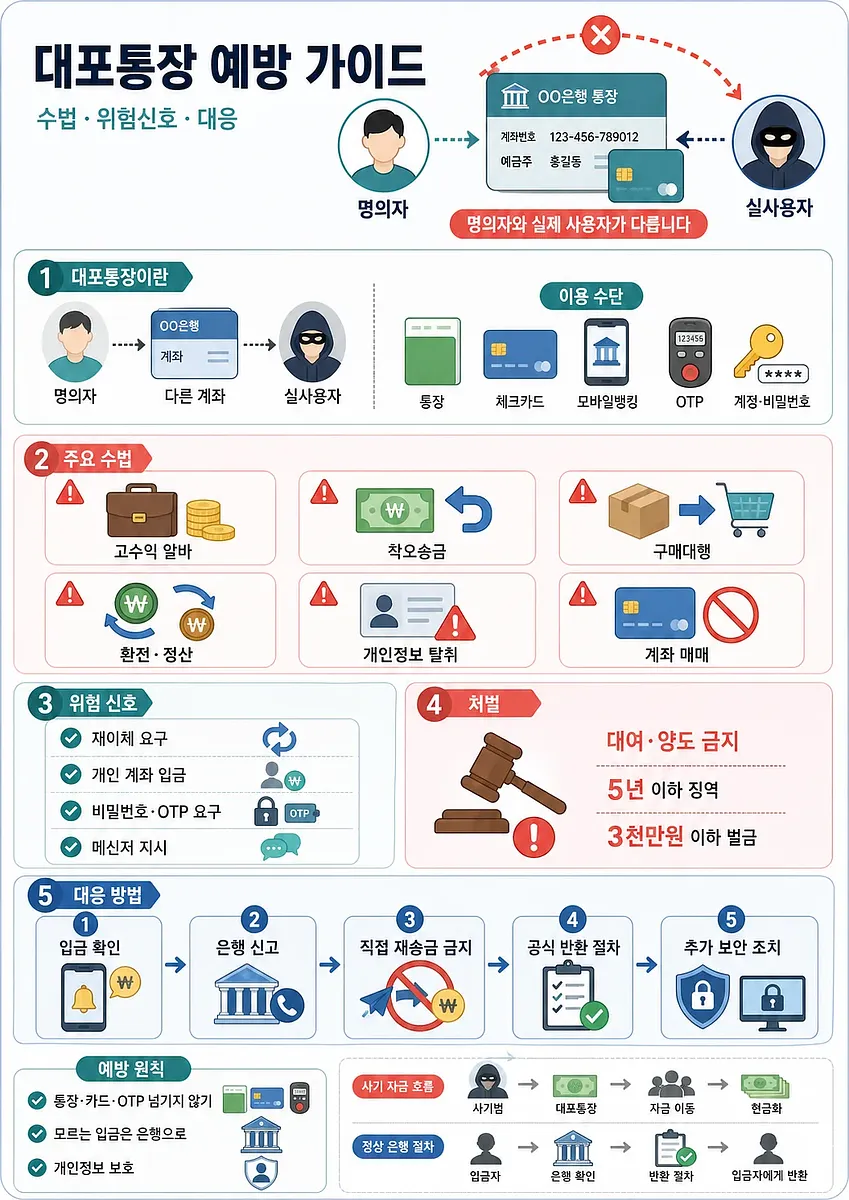
The infographic summarizes how mule accounts are misused and how to respond safely to suspicious deposits.
How Are "Ghost Accounts" Created, and How Can They Be Prevented?
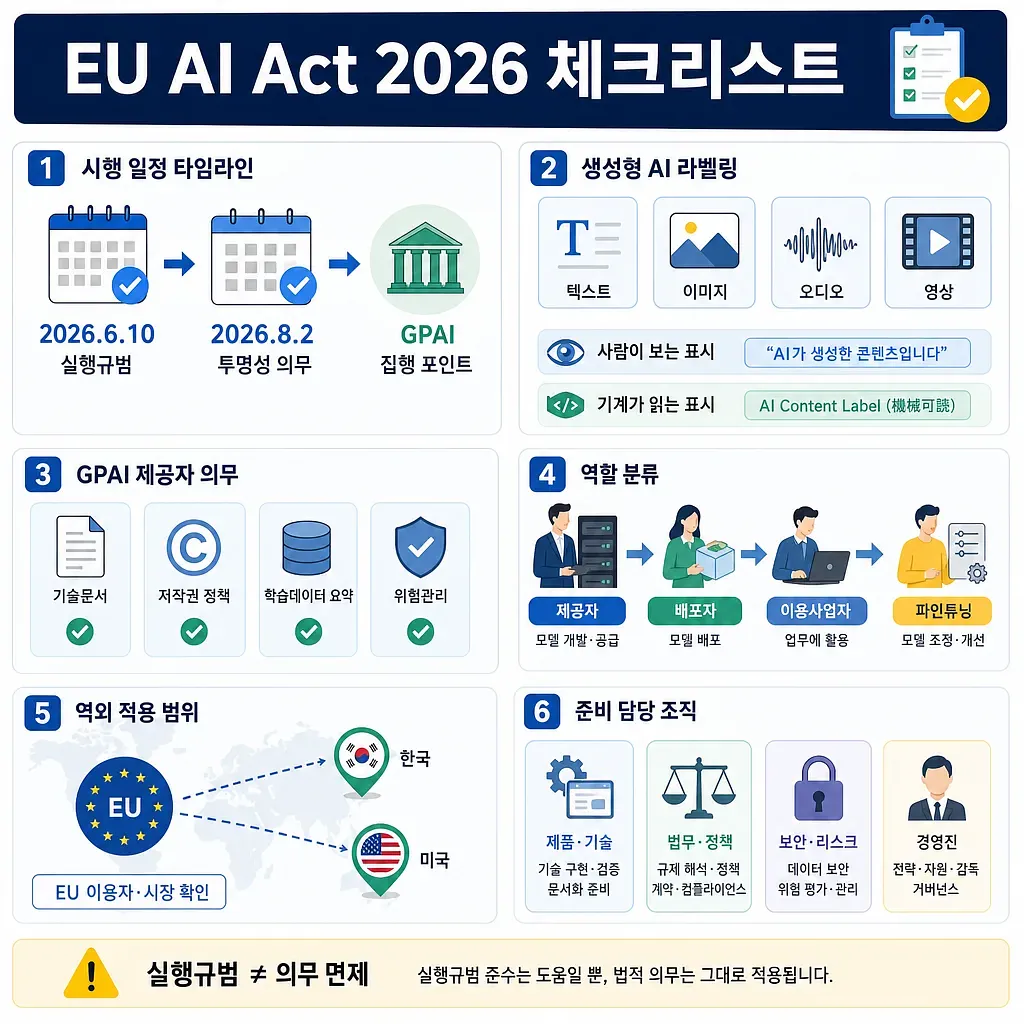
The graphic outlines timelines, AI labeling, GPAI duties, roles, scope, and responsible teams.
Checklist for the EU AI Act, Effective August 2026: Generative AI Labeling and GPAI Requirements
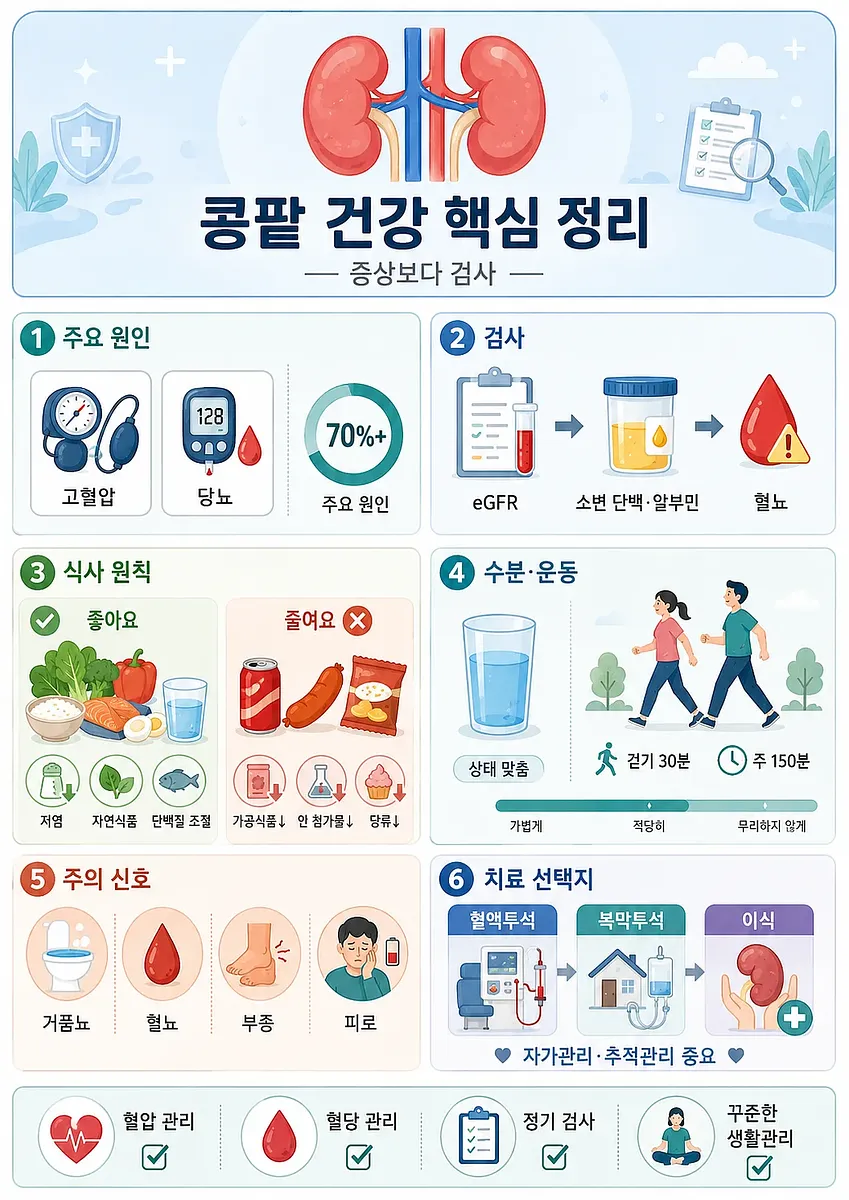
The infographic organizes chronic kidney disease prevention and care into causes, tests, diet, exercise, warning signs, and treatments.
How to Maintain Kidney Health: Understanding Diet, Exercise, Dialysis, and Transplantation for Chronic Kidney Disease
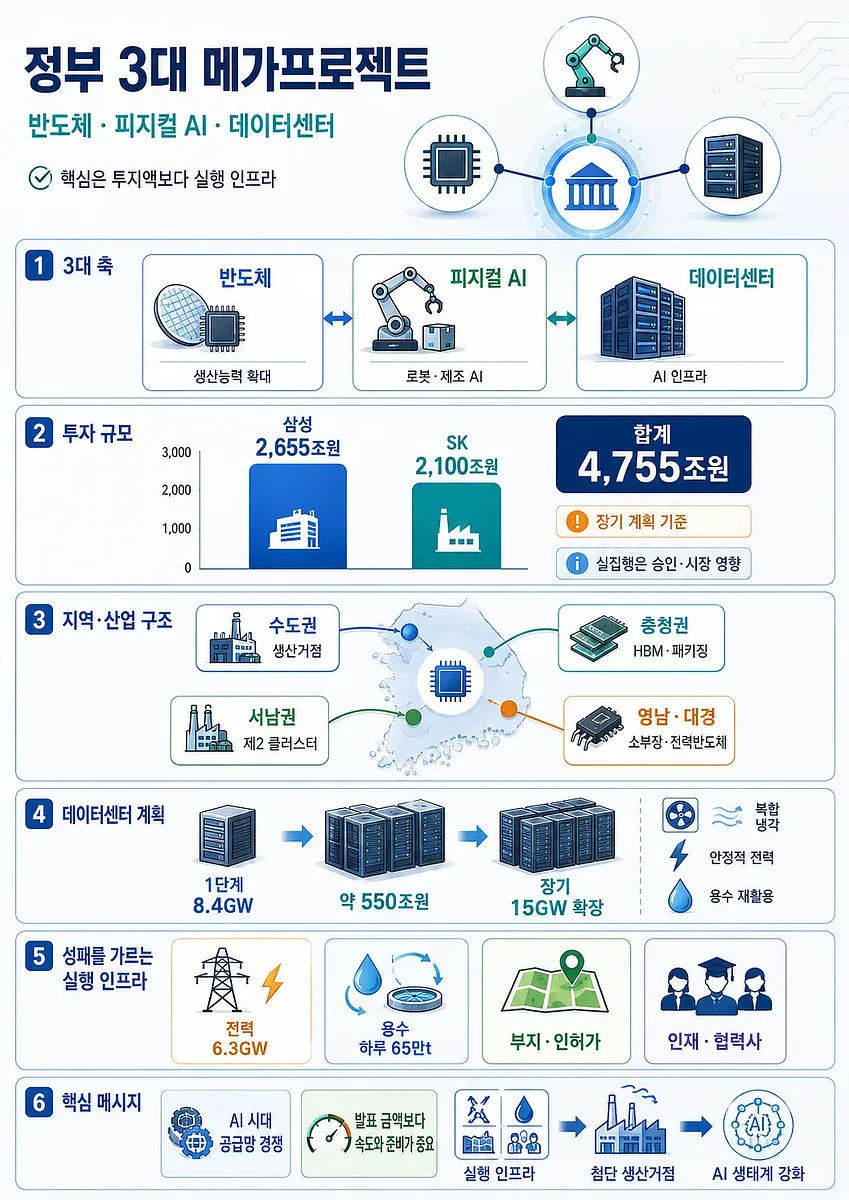
The infographic organizes the semiconductor, physical AI, data center strategy, and key execution infrastructure.
Summary of the Government’s Three Major Mega-Projects: Semiconductors, Physical AI, and Data Centers
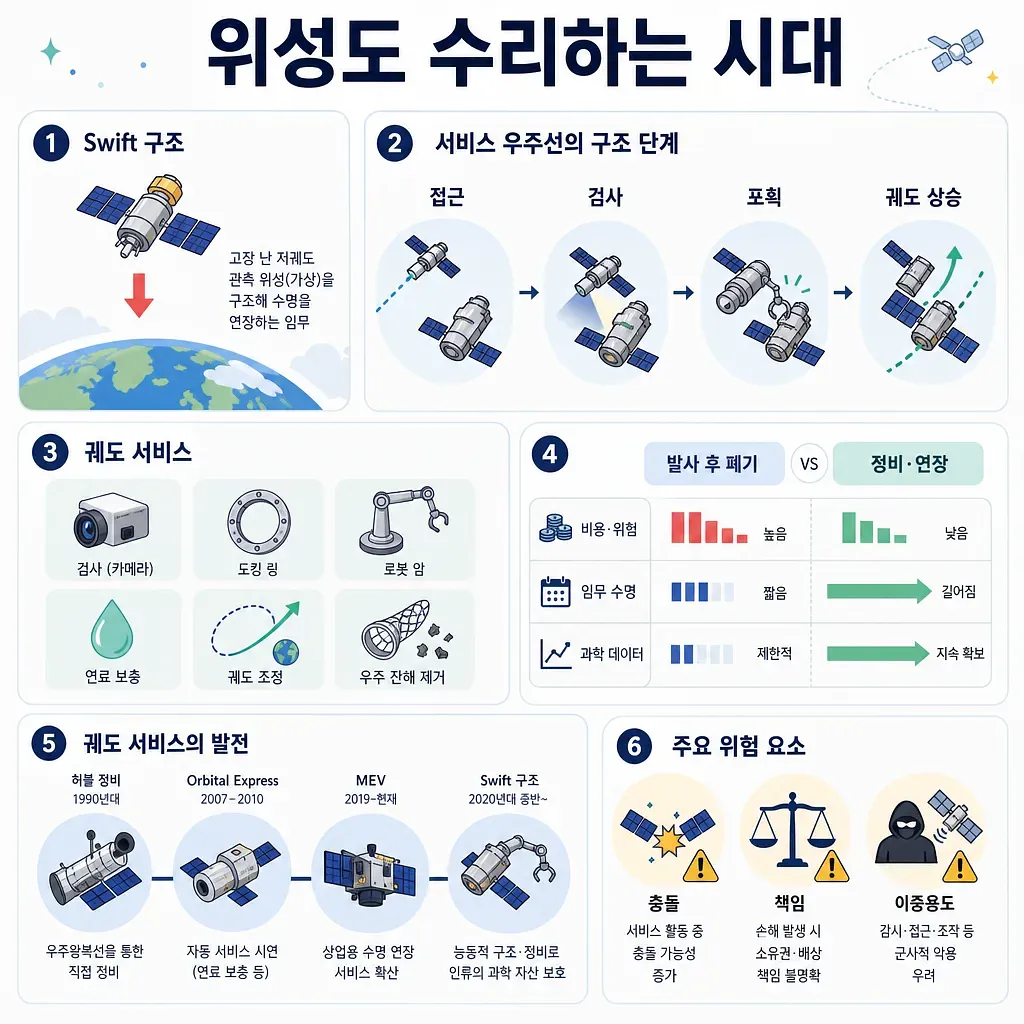
The graphic summarizes satellite servicing through the Swift rescue mission, including steps, benefits, and risks.
The Era of Repairing and Reusing Satellites: NASA’s Swift Rescue Mission and the Orbital Services Industry
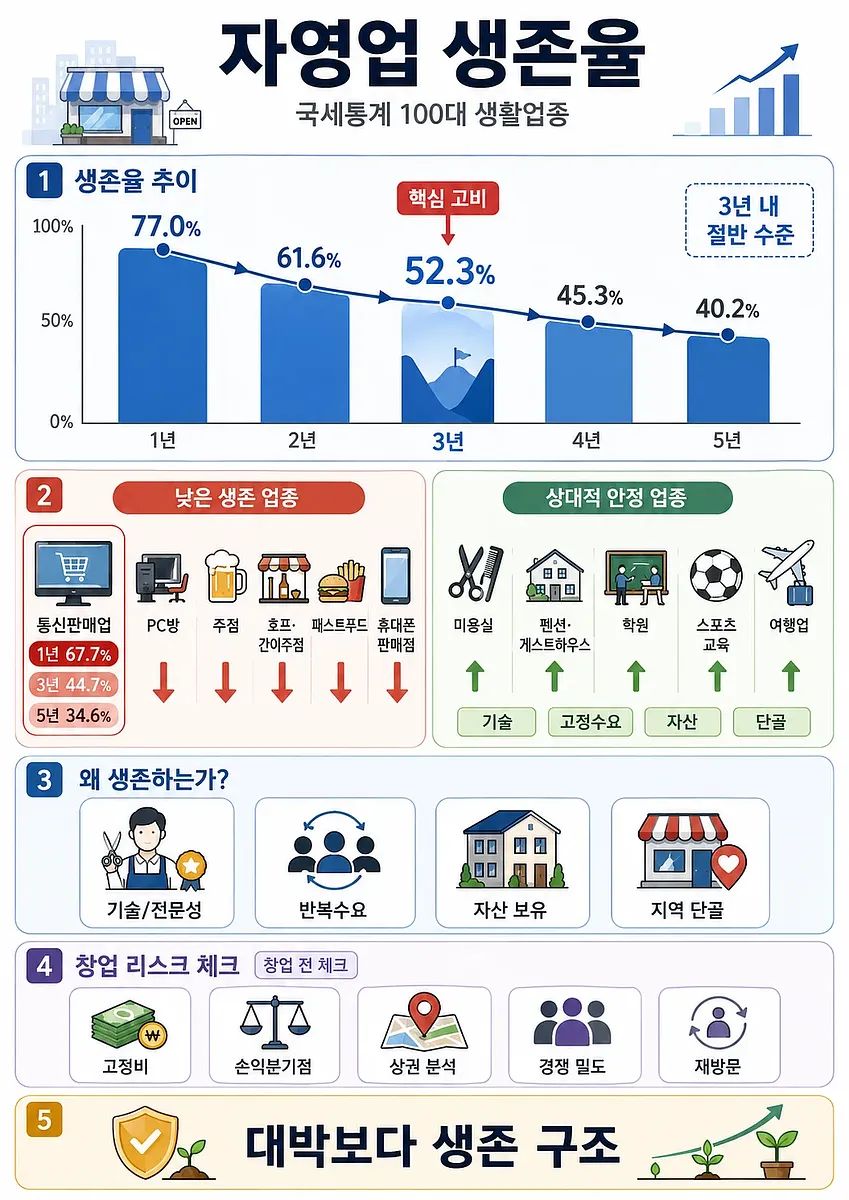
The infographic summarizes survival-rate trends, vulnerable industries, stable sectors, and key startup risk checks.
Survival Rates of Self-Employed Businesses Based on National Tax Statistics: Industries Where Half Disappear Within Three Years and Those That Endure
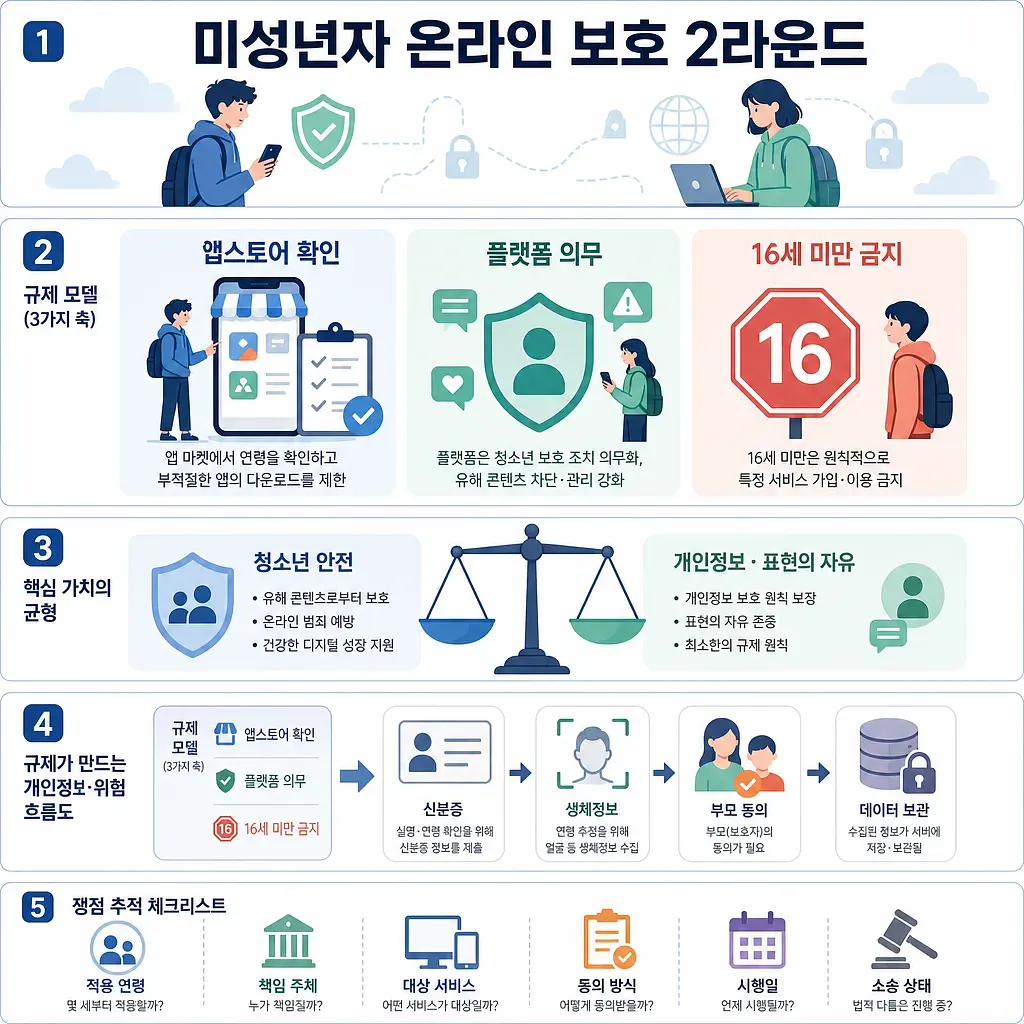
The graphic compares app store age checks, platform duties, under-16 restrictions, and data risks.
Round 2 of Online Protection for Minors: Age Verification on App Stores, Social Media Bans, and Comparison of Personal Information Risks
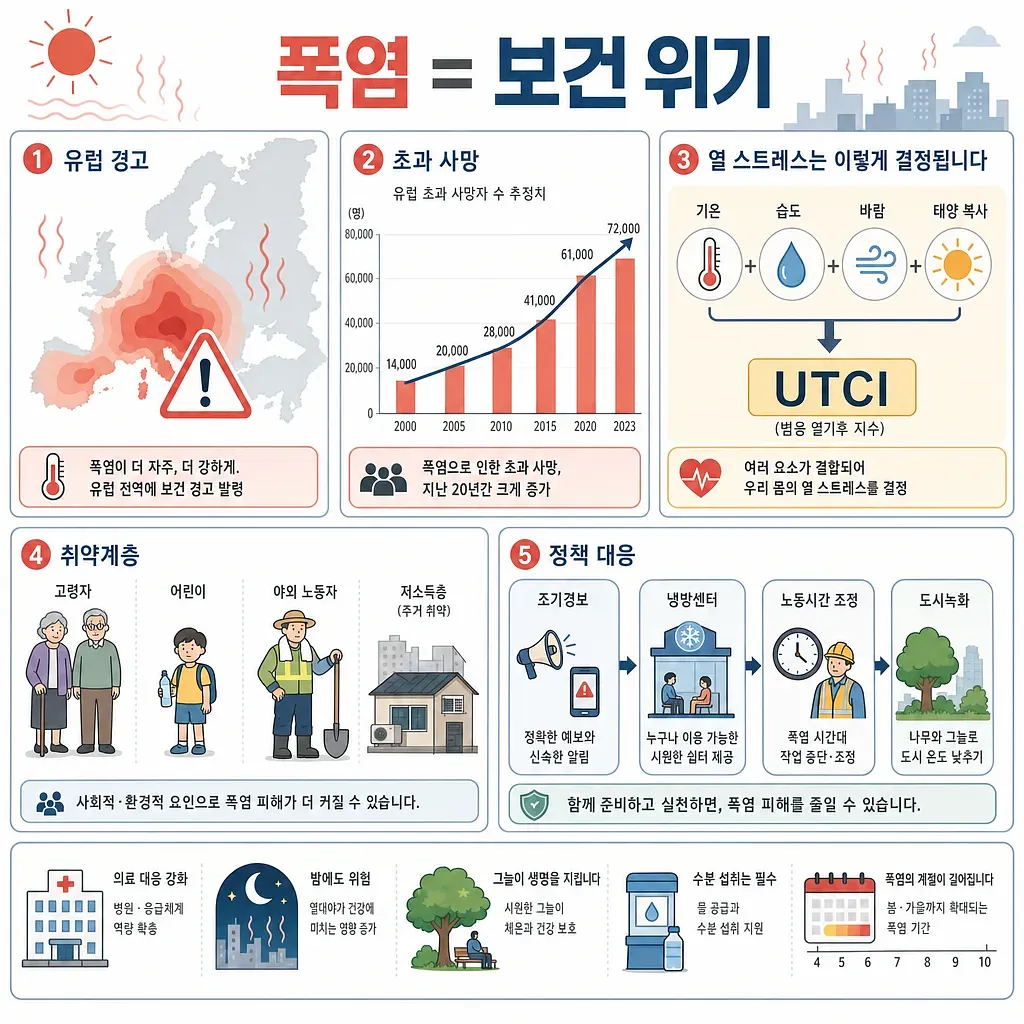
The graphic summarizes European heat alerts, rising excess deaths, heat stress factors, and policy responses.
Heat Waves Are No Longer Just “Weather”—They’re a Public Health Crisis: Reading About Rising Deaths in Europe and Global Heat Stress Research
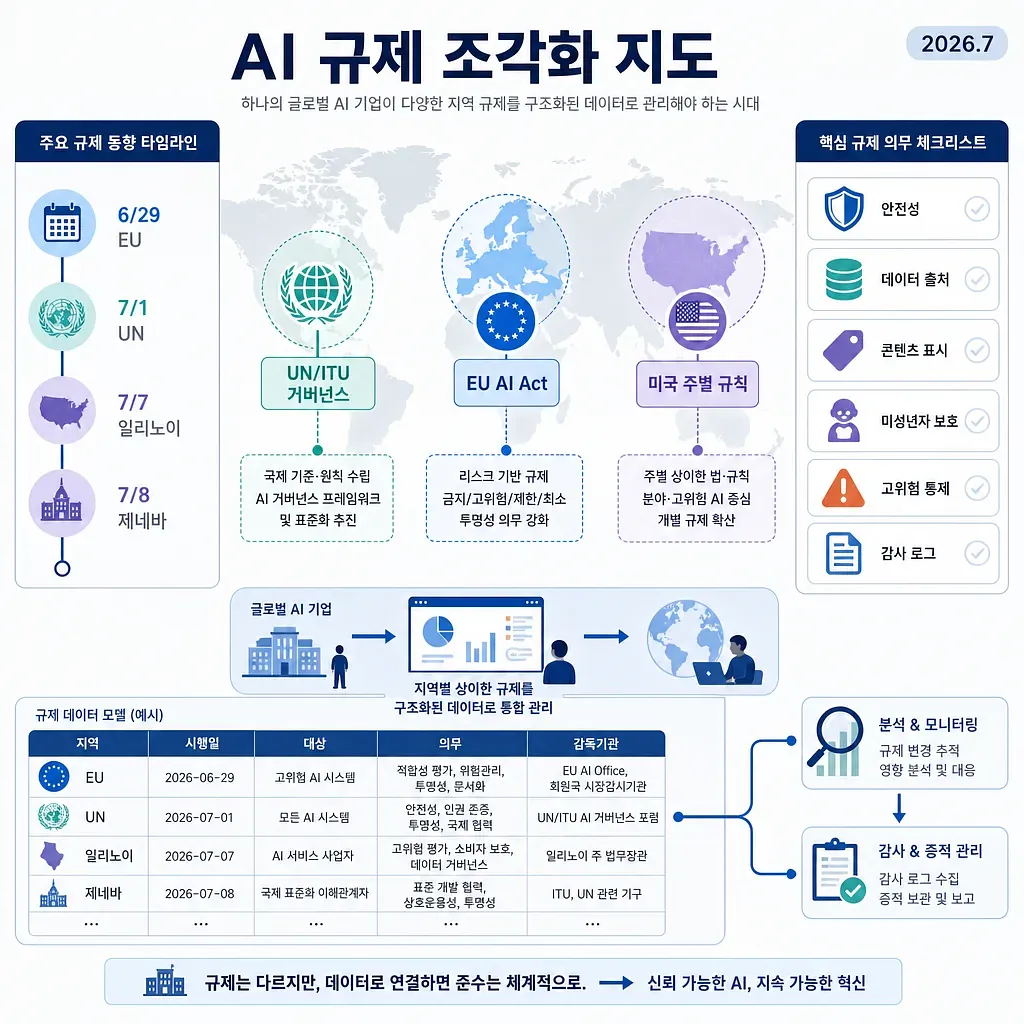
The infographic maps UN, EU, and U.S. state AI rules with timelines, duties, and compliance workflows.
Fragmentation of AI Regulation by Country: A Map of UN, EU, and U.S. State Regulations as of July 2026
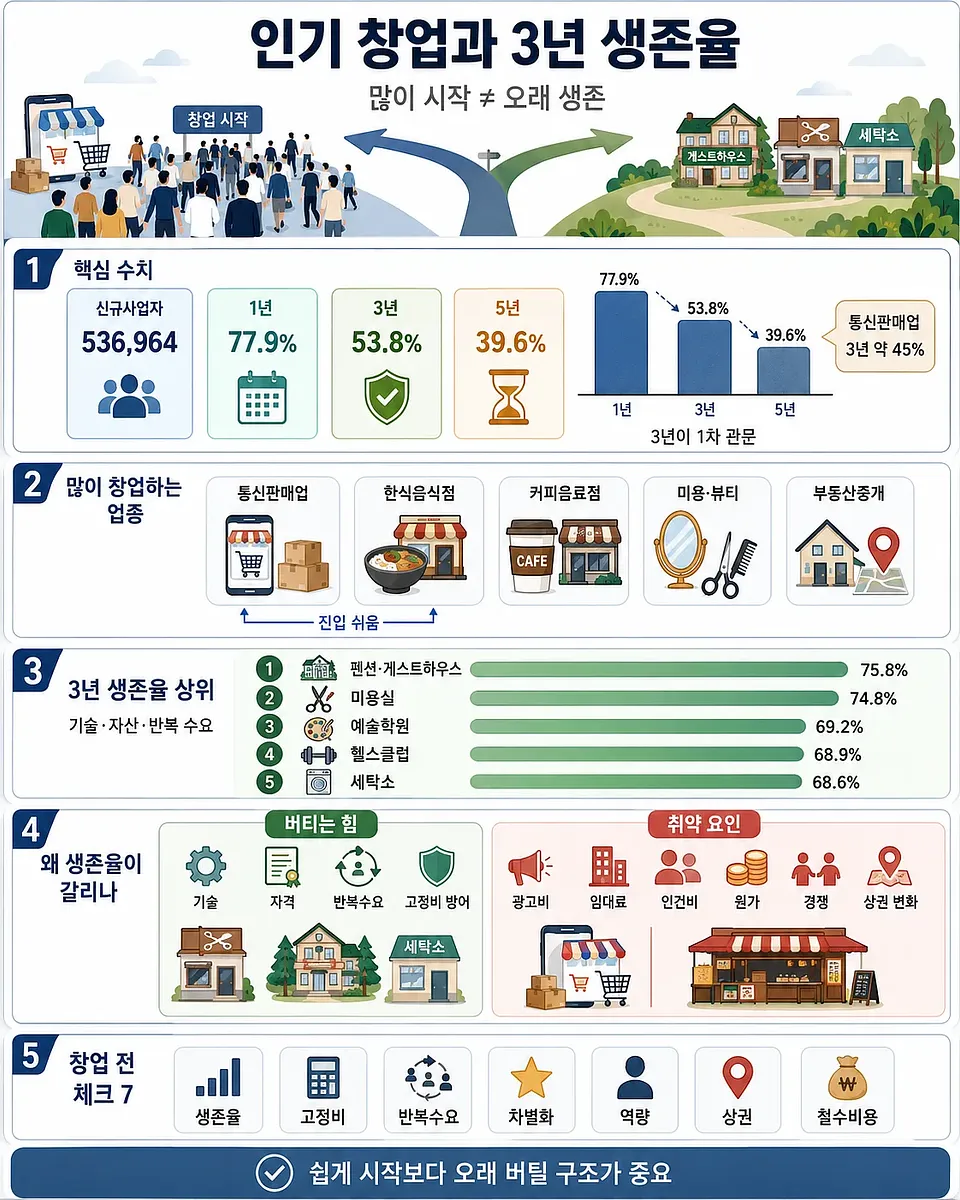
The infographic compares startup statistics, business types, survival factors, risks, and preparation points.
Popular Startup Sectors and 3-Year Survival Rates Based on National Tax Statistics
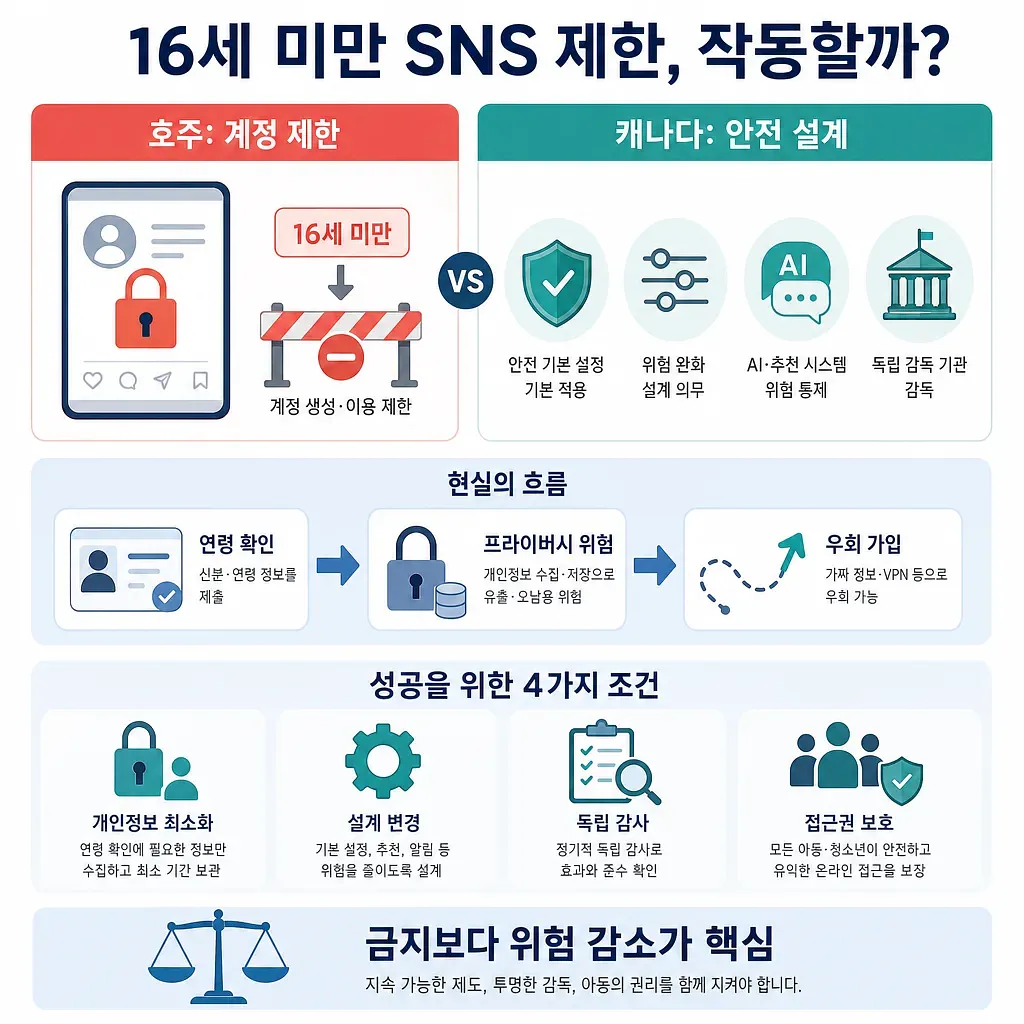
The graphic contrasts Australia’s account restrictions with Canada’s safety-by-design approach and key safeguards.
Will Social Media Restrictions for Children Under 16 Actually Work? A Comparison of Online Safety Regulations for Children in Australia and Canada
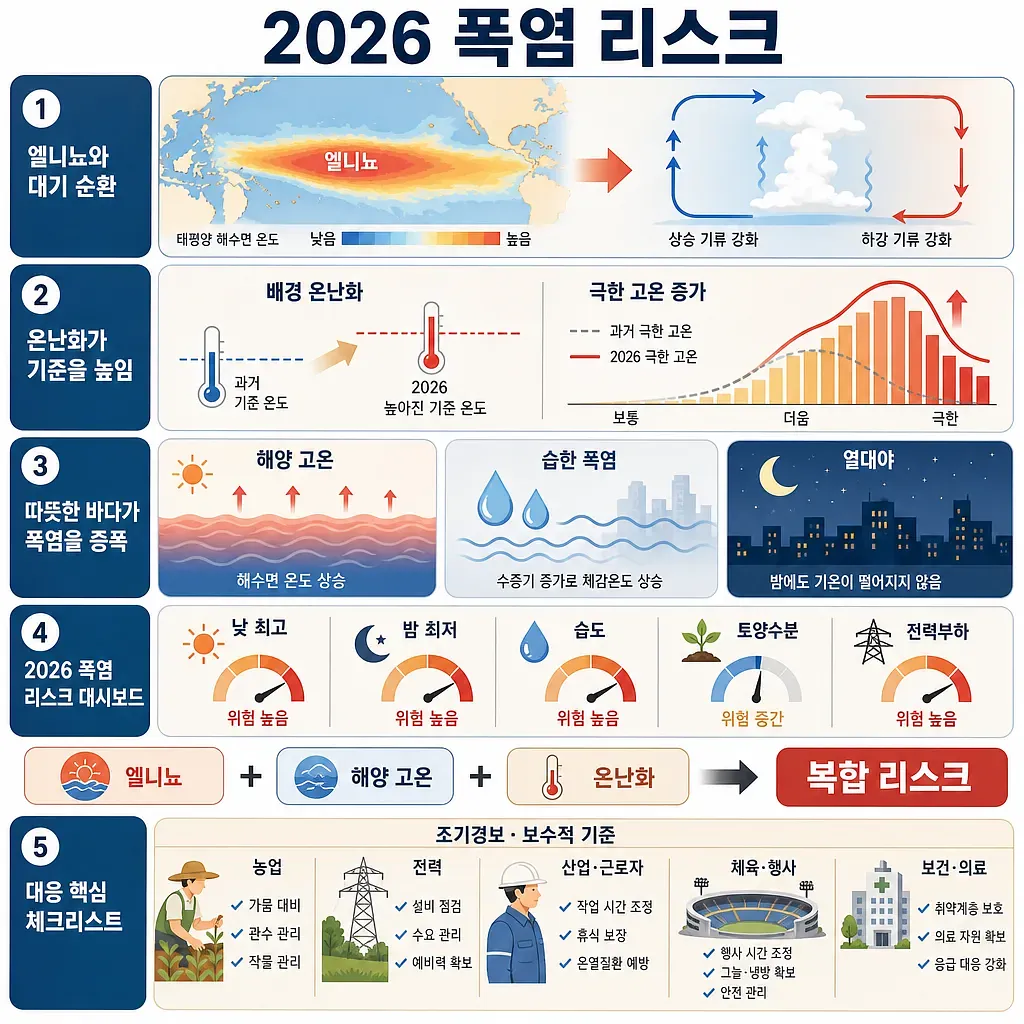
The chart summarizes 2026 heatwave risk through El Niño, marine heat, warming, and preparedness steps.
When El Niño and Ocean Warming Converge: Assessing the Risk of a Heat Wave in the Summer of 2026
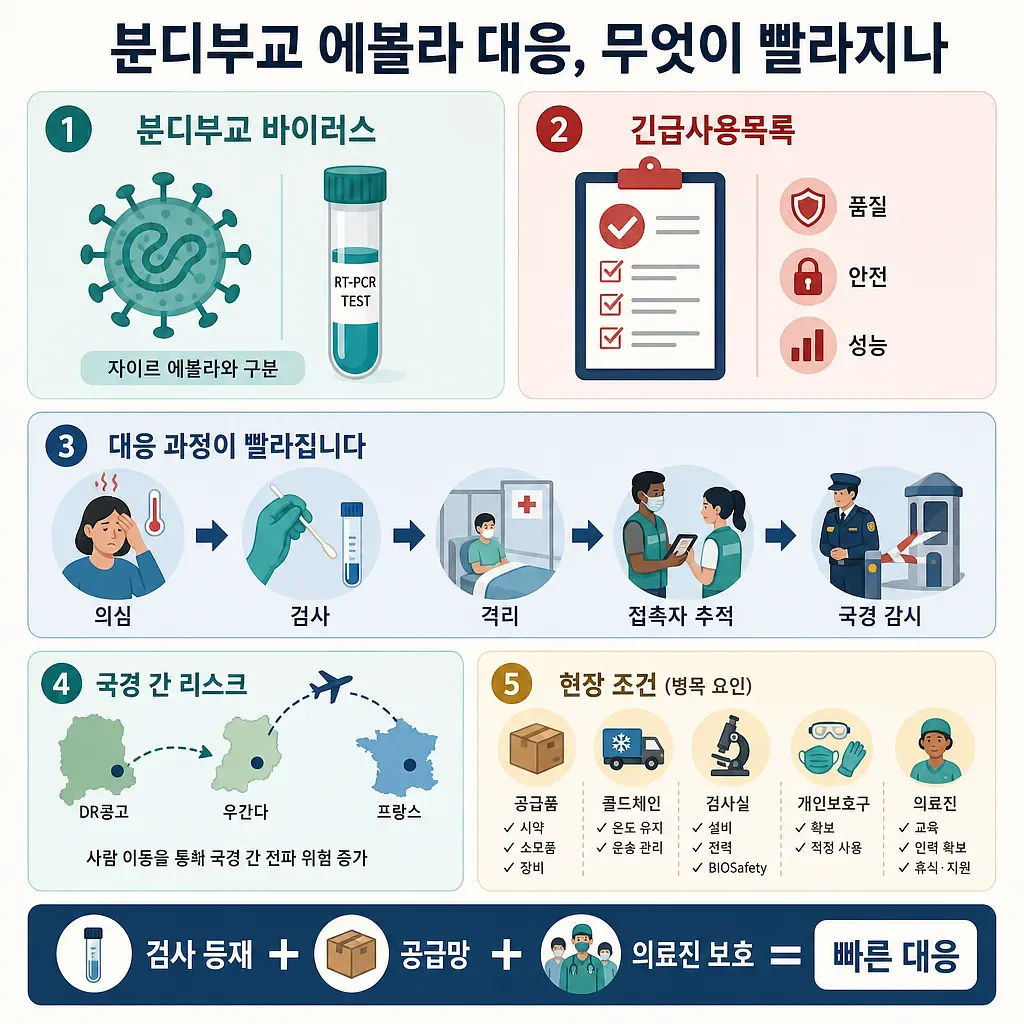
The graphic summarizes how WHO emergency-use diagnostics could speed the Bundibugyo Ebola response.
Will the Ebola Response in Bundibugyo Accelerate? The Significance of the WHO’s First Emergency Use Listing of a Diagnostic Test
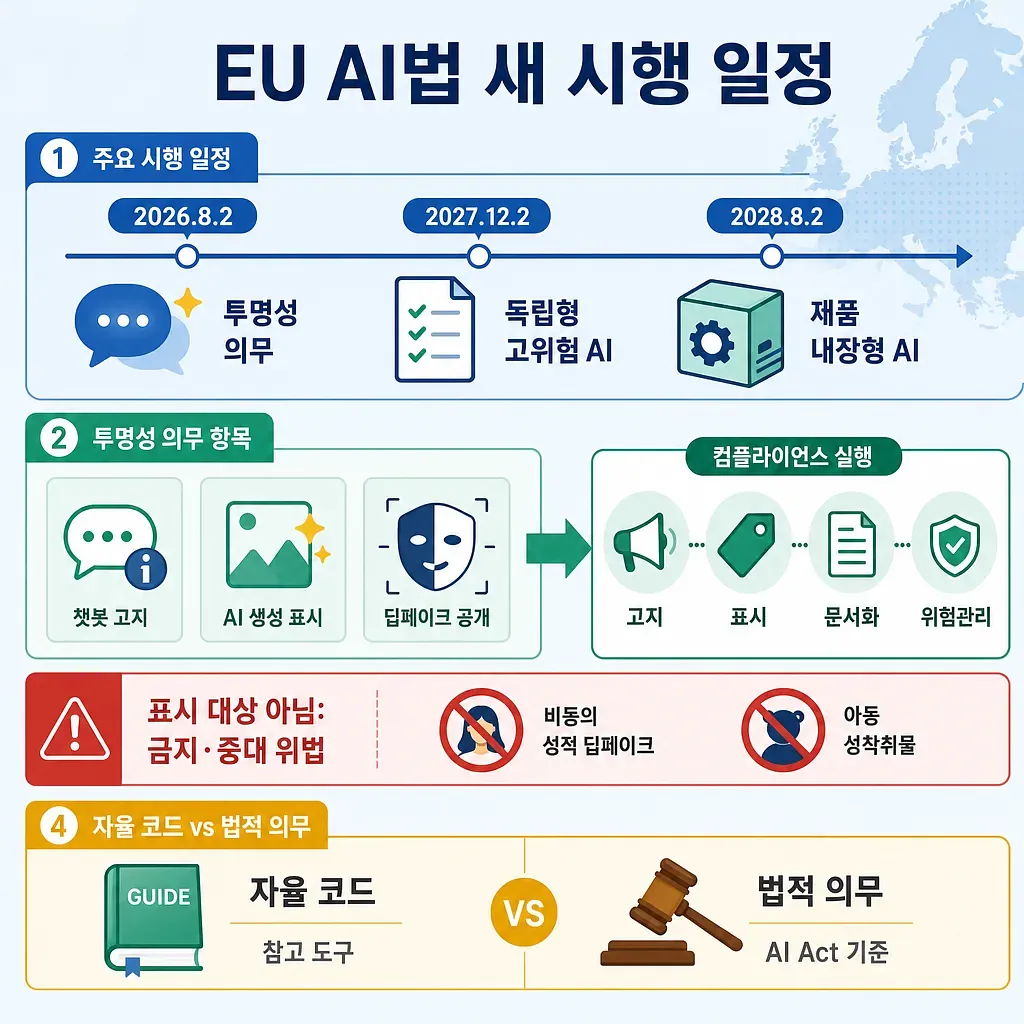
The graphic outlines key EU AI Act dates, labeling requirements, compliance steps, and legal obligations.
The EU AI Act’s implementation schedule has changed again: New standards for generative AI labeling and high-risk AI regulations
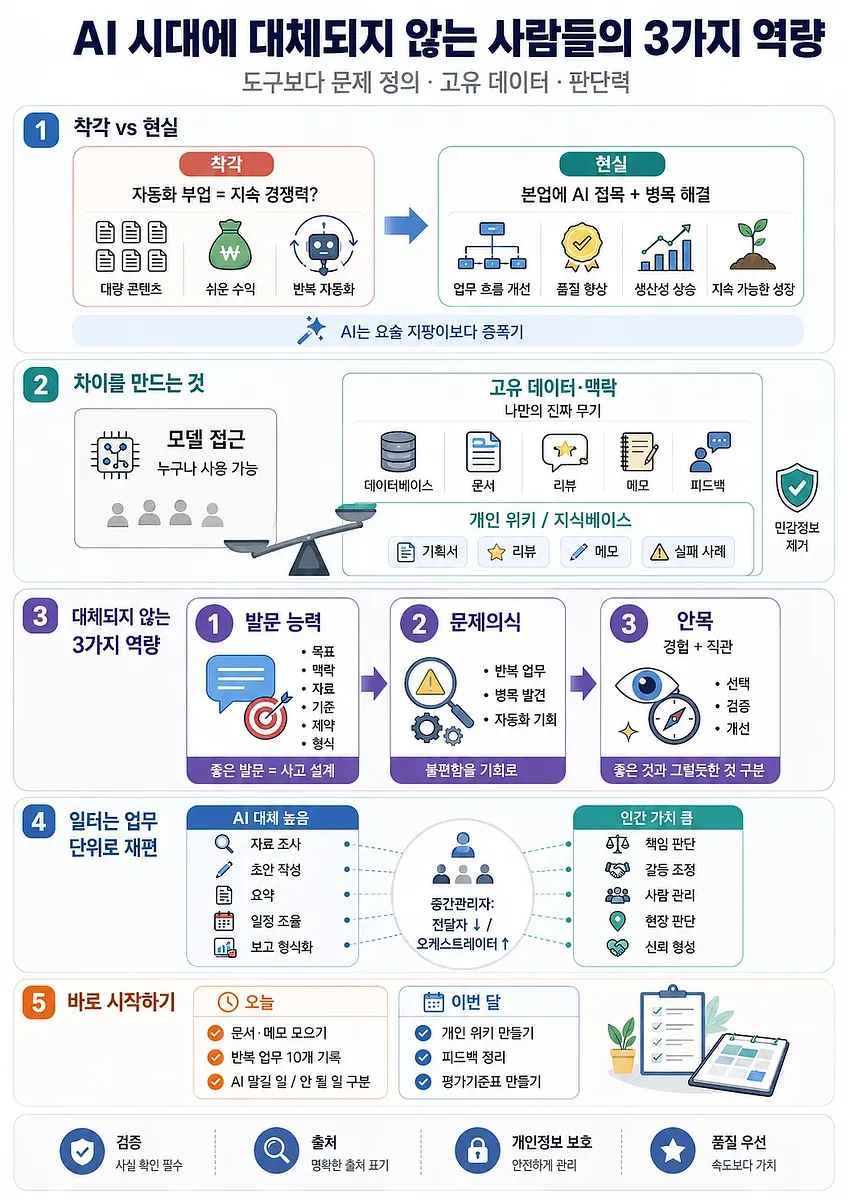
The infographic visualizes the key human strengths that remain valuable in the AI era.
3 Skills That Will Keep People from Being Replaced in the Age of AI
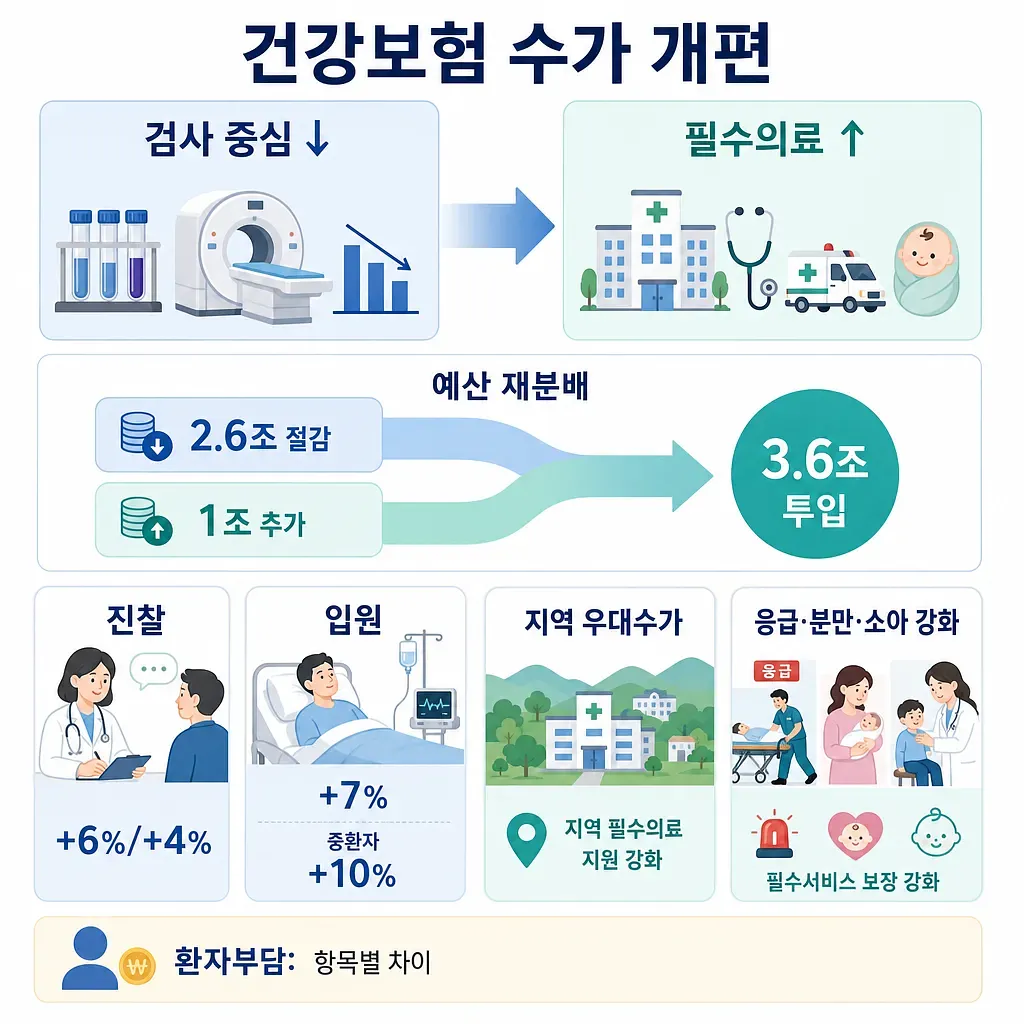
The graphic shows budget redistribution from test-based payments toward consultations, hospitalization, and regional essential care.
Reform of the Health Insurance Fee Schedule: Shifting from a Test-Centric Approach to a Focus on Regional and Essential Healthcare
 Injoys