Korea's Entry into a Super-Aged Society and Its 2050 Outlook Based on the 2025 Population Census
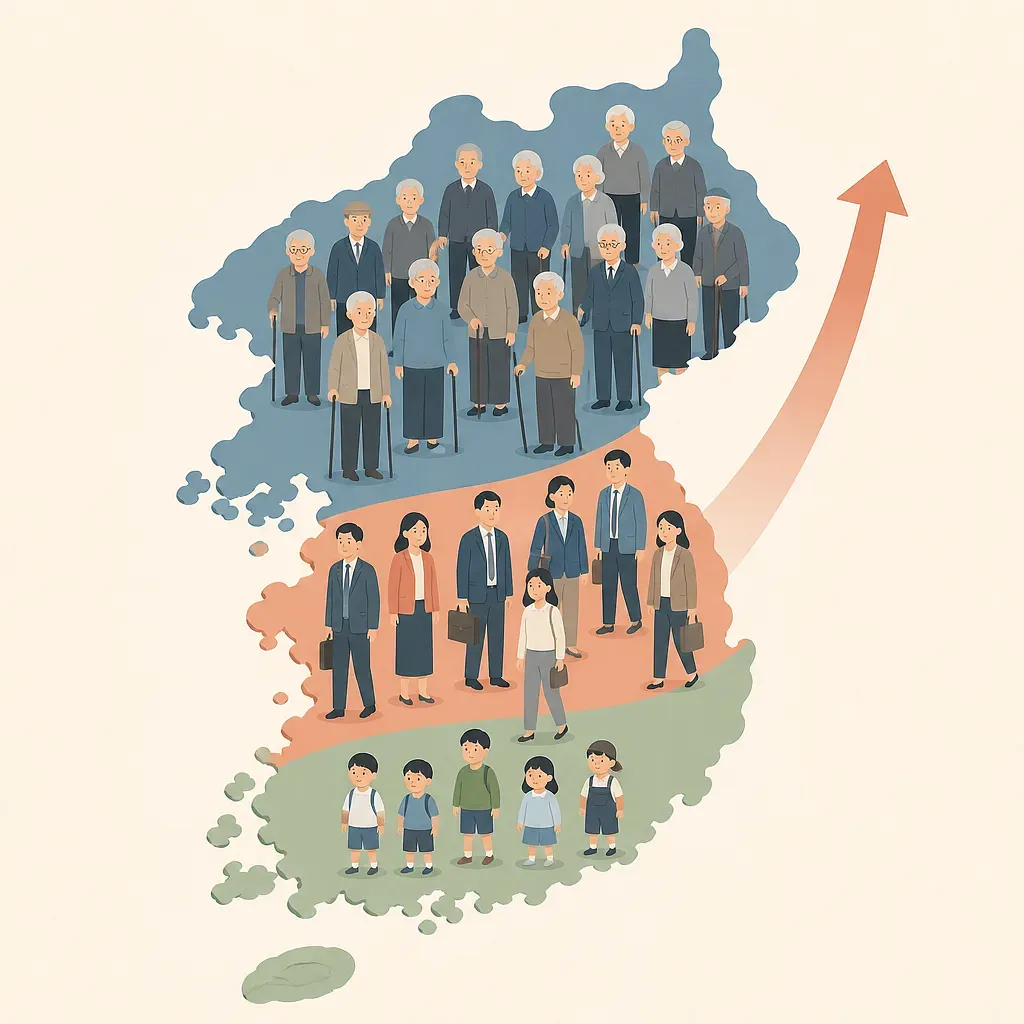
In 2025, 10.72 million residents of Korea were aged 65 or older, accounting for 20.7% of the population and surpassing the conventional threshold for a super-aged society. If future population projections hold, this share will reach approximately 40% by 2050, making structural changes across the labor force, pensions, healthcare, care services, and local communities inevitable.
In 2025, Korea had 10.72 million residents aged 65 or older, accounting for 20.7% of the total population.
The working-age population aged 15–64 accounted for 69.2%, while children aged 0–14 accounted for 10.1%.
The aging index was 205, meaning there were approximately 205 older people for every 100 children.
An old-age dependency ratio of 29.9 is a demographic indicator meaning there are approximately 30 older people for every 100 working-age people; it does not mean that 3.3 actual workers support one older person.
Future population projections forecast that people aged 65 or older will account for approximately 40% of the population by 2050, but the outcome may vary depending on births, deaths, and migration.
South Korea’s population aged 65 and older has exceeded 20% not only according to the resident registration population but also according to the Population and Housing Census, which counts people actually residing in the country. This means that population aging is not merely an issue affecting certain regions or specific systems, but a nationwide structural transformation reshaping the labor market, public finances, healthcare, care services, housing, and transportation together.
However, a “super-aged society” is not a status officially granted following review by an international organization. It is generally a statistical term referring to a society in which people aged 65 and older account for at least 20% of the total population, and international comparisons must use data with the same survey scope and reference date.
Key Figures for South Korea’s Population in 2025
In the 2025 Population and Housing Census, the population aged 65 and older among residents of South Korea was estimated at 10.72 million, or 20.7% of the total. This is equivalent to approximately one in five nationals or residents.
Indicator | 2025 figure | Interpretation
Older population aged 65 and over | 10.72 million | People aged 65 and older among residents of South Korea
Share of older population | 20.7% | More than the conventional 20% threshold for a super-aged society
Share of working-age population aged 15–64 | 69.2% | The share of the total population in the age group central to economic activity
Share of young population aged 0–14 | 10.1% | The age group forming the basis of the future workforce and school-age population
Aging index | 205 | Approximately 205 older people per 100 young people
Old-age dependency ratio | 29.9 | Approximately 30 older people per 100 working-age people
The shares of the three age groups total 100%: 20.7% older population, 69.2% working-age population, and 10.1% young population. The simultaneous increase in the older population and decline in the young population is the defining feature of South Korea’s demographic structure.
How Does the Resident Population Differ from the Resident Registration Population?
The resident registration population is compiled primarily from South Korean nationals listed in resident registration records. By contrast, the resident population in the Population and Housing Census identifies people who usually reside in South Korea under the survey criteria, so it may include foreign nationals who meet certain requirements and exclude South Korean nationals who have lived overseas for an extended period.
Category | Resident registration population | Population and Housing Census resident population
Basic purpose | Identify the administrative status of resident registration | Identify the population and household structure of people actually living in South Korea
Foreign nationals | Not included in the general resident registration population | May be included if they meet the requirements for usual residence in South Korea
South Korean nationals residing overseas long-term | May remain depending on their resident registration status | May be excluded based on their usual place of residence
Main uses | Local administration, elections, resident services, etc. | Population, household, and housing policies; international comparisons; etc.
Accordingly, the point at which the share of the older population exceeded 20%, as well as the reported figure, may differ slightly between the two statistics. Neither figure is incorrect; their target populations and purposes of compilation differ.
The Precise Meaning of a Super-Aged Society
Under the conventional classification of age structures, societies are described as follows according to the share of the population aged 65 and older.
· At least 7%: aging society
· At least 14%: aged society
· At least 20%: super-aged society
These categories are conventional thresholds used to communicate population structures simply. There is no procedure under which international organizations such as the UN review individual countries and certify them as “official super-aged societies.” It is therefore more accurate to say that South Korea has exceeded 20% even under the resident population standard used for international comparisons.
Moreover, classifying people aged 65 and older as the older population in statistics does not mean that everyone aged 65 and older has the same health, income, or employment status. When designing policies, the groups aged 65–74, 75–84, and 85 and older should be examined separately, together with healthy life expectancy, disability status, household type, and income.
How to Read the Aging Index and Old-Age Dependency Ratio
Aging Index
The aging index is calculated by dividing the older population by the young population and multiplying by 100.
Aging index = population aged 65 and over ÷ population aged 0–14 × 100
Applying the 2025 shares gives 20.7 ÷ 10.1 × 100, or approximately 205. This means there are approximately 205 older people per 100 young people. Compared with approximately 95 a decade earlier, it shows that the balance in population size between generations has changed rapidly.
Old-Age Dependency Ratio
The old-age dependency ratio is calculated by dividing the older population by the working-age population and multiplying by 100.
Old-age dependency ratio = population aged 65 and over ÷ population aged 15–64 × 100
In 2025, 20.7 ÷ 69.2 × 100 gives approximately 29.9. Arithmetically, this is equivalent to one older person for approximately every 3.3 working-age people.
However, it would be inaccurate to interpret this indicator as meaning that “3.3 employed people actually support one older person.” The working-age population includes students, job seekers, full-time caregivers, and economically inactive people, while a significant number of people aged 65 and older are also employed. The old-age dependency ratio is an indicator of pressure from the age structure, not a measure of actual family relationships or tax burdens.
Why the Decline in the Working-Age Population Matters
In 2025, the share of the working-age population aged 15–64 fell below 70% to 69.2%. In the past, the share of the working-age population was relatively low because the young population was large; today, the main causes are low birth rates and growth in the older population.
A decline in the working-age population does not immediately mean that the economy will contract by the same proportion. Employment rates among women and older people, working hours, immigration, automation, educational attainment, and productivity all play a role. However, if other conditions remain the same, the following pressures may increase.
· Labor shortages may intensify in industries and regions where recruitment is difficult.
· The economy’s overall potential growth rate may decline.
· The population base paying insurance premiums and taxes may become relatively narrower.
· Demand for spending on pensions, health insurance, long-term care, and care services may increase.
· Declining student numbers may accelerate the restructuring of schools, universities, and regional education infrastructure.
Can an Increase in Births Alone Reverse the Trend?
South Korea’s number of births and total fertility rate have shown signs of rebounding from extremely low levels. In 2025, the number of births was reported to be approximately 254,000, with the total fertility rate at around 0.80.
The rebound itself is an important change, but it is difficult to reverse the aging trend in the short term. It takes at least 15 years for newborns to enter the working-age population, and the number of women of childbearing age is also structurally declining. Further observation is needed to determine whether the short-term increase in marriages and births will lead to a sustained recovery.
Population aging cannot be addressed solely through policies to raise the fertility rate. Alongside support for children and families, simultaneous efforts are needed to improve labor productivity, retrain middle-aged and older people, expand employment for older people, promote immigration and social integration, extend healthy life expectancy, and reform the care system.
What Will Change by 2050?
Under the medium scenario of the national population projections, the share of South Korea’s population aged 65 and older is projected to reach approximately 40% by 2050. This would mean that approximately four in ten people are aged 65 and older. The first and second baby-boom generations, born between 1955 and 1974, will also all be aged 75 and older.
The 2050 figure is not a fixed future. It is a conditional projection that may change depending on birth rates, life expectancy, international migration, and policy changes. Even so, because the current age structure already reflects people who have been born, the likelihood of the medium- to long-term direction of population aging changing substantially in a short period is limited.
Labor Market
As the working-age population declines, companies are likely to expand automation and job redesign while making more active use of women, young people, middle-aged and older workers, and foreign workers. Discussions concerning the mandatory retirement age, continued employment, wage systems, and job-based personnel systems may also expand.
Pensions and Public Finances
While the base of people paying insurance premiums shrinks relatively, the number of pension recipients and age-related expenditures increases. Improving the sustainability of these systems requires considering not only premiums, benefits, and the pension eligibility age, but also employment rates and economic growth rates.
Healthcare and Long-Term Care
As the older population grows, healthcare utilization is likely to increase, but costs are not determined by population size alone. Chronic disease prevention, healthy life expectancy, the healthcare delivery system, and the prices of pharmaceuticals and new technologies also have an impact. In particular, increases in the populations aged 75 and older and 85 and older may directly affect demand for home visits, home healthcare, long-term care, and family caregiving.
Housing and Transportation
Housing with fewer stairs and thresholds, elevators, pedestrian-friendly roads, and public transportation will become increasingly important. If the number of older single-person households increases, housing assistance must be combined with support addressing isolation, safety, meals, and daily living.
Regional Disparities
Rural and fishing communities and small and medium-sized cities experiencing a large outflow of young people may face high aging rates earlier than the national average. There is also a risk that the contraction of essential infrastructure—including hospitals, public transportation, stores, and care workers—will further accelerate population decline.
Points to Consider When Interpreting Projections
· Projections for 2050 may vary depending on medium, high, low, and other assumptions.
· Even with the same population shares, economic outcomes differ if employment rates and productivity differ.
· Treating everyone aged 65 and older as a single group may obscure differences in health and care needs.
· The resident registration population, census resident population, and projected population differ in purpose and scope, so their criteria must be checked when comparing figures directly.
· “Dependency” indicators are ratios between age groups and do not measure actual support relationships involving individuals or families.
Key Conclusion
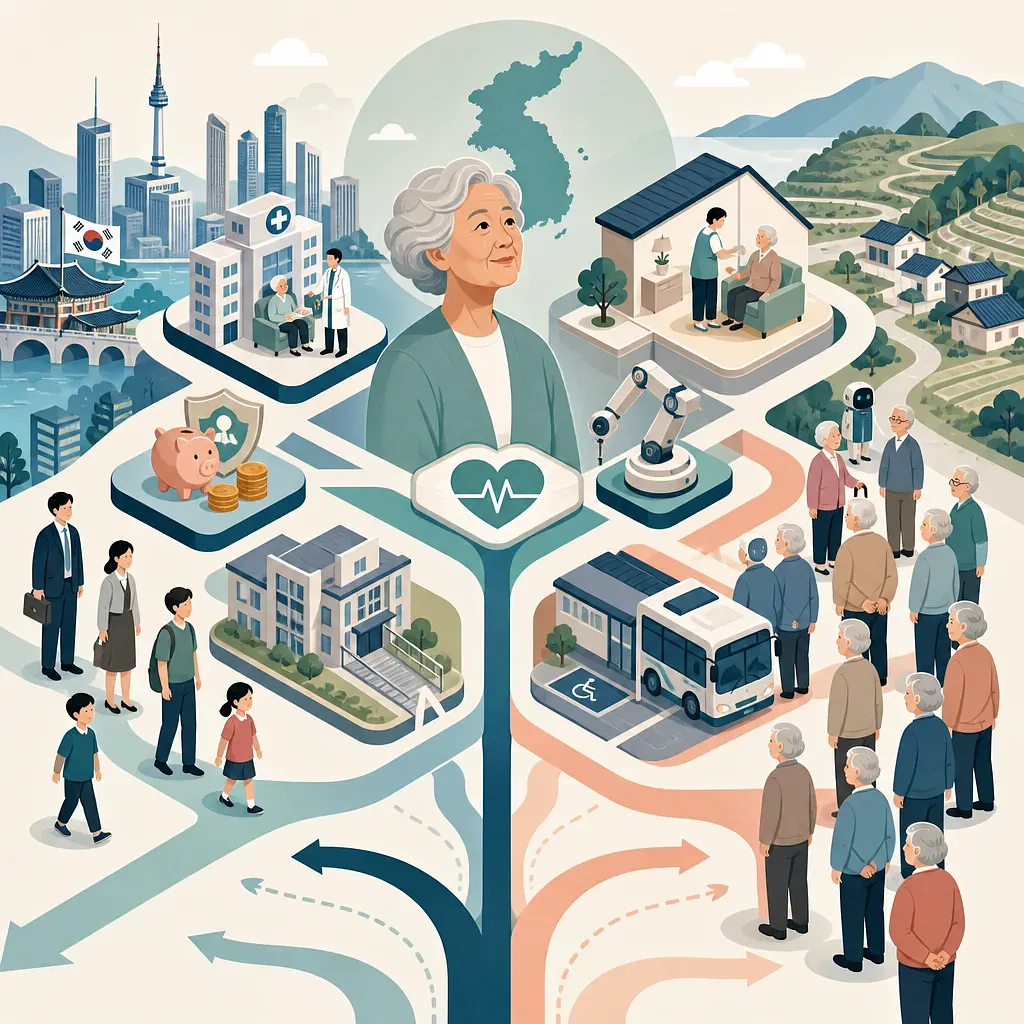
South Korea’s entry into a super-aged society means more than simply having more older people. As the young and working-age populations decline and the older population grows, the labor market, welfare finances, healthcare, care services, and regional infrastructure are all being restructured simultaneously.
To reduce the impact in 2050, South Korea cannot simply wait for the birth rate to recover. It must prepare simultaneously by creating an environment in which people can work longer in good health, improving productivity, establishing sustainable social insurance, developing community-based healthcare and care services, and expanding age-friendly housing.
 Injoys