Strait of Hormuz Counter-Blockade: Shipbuilding Criteria
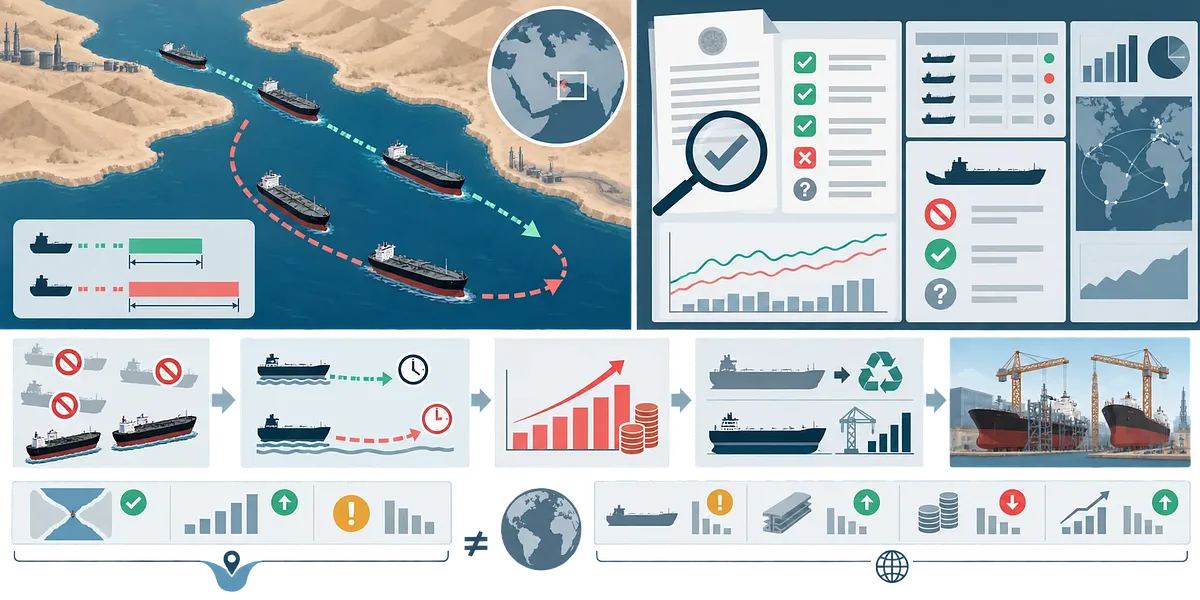
The Strait of Hormuz counter-blockade is a claim that first requires official confirmation. Even if confirmed, it must be separately verified whether the removal of sanctioned vessels, longer shipping routes, and higher freight rates will lead to new tanker orders.
The executive order and operational scope of the counter-blockade must be verified through original US government documents.
Not all vessels in the shadow fleet are illegal or unregistered.
If a 20-day route increases to 30 days, the simple vessel-days required for that shipment increase by 50%.
An increase in sailing days does not mean the world needs 50% more tankers.
Benefits to the shipbuilding industry must be assessed separately in terms of freight rates, vessel scrapping, orders, ship prices, and profitability.
The Strait of Hormuz “reverse blockade” is a claim that requires official confirmation. Even if confirmed as fact, it would not automatically lead to a surge in tanker orders. Investment decisions should sequentially examine the scope of sanctions, transit volumes, ton-miles, freight rates, scrapping, and orders.
No reference date provided for figures: Check the latest original documents from the U.S. Treasury’s OFAC, EIA, and IMO
Official Confirmation Status of the Reverse Blockade Claim
“Reverse blockade” is difficult to regard as a widely established official policy name. No executive order number supporting the reverse blockade has been provided either. The vessels targeted and the enforcement agencies involved also require official confirmation. Seizure and port-entry restrictions differ in their legal nature.
U.S. sanctions against Iran are administered by the U.S. Treasury’s OFAC. Designated vessels can be searched through the OFAC Sanctions List Search. Announcements of military operations should be checked with U.S. Central Command. White House announcements and executive orders should also be cross-checked.
No basis has been found for directly quoting official language. The U.S. Treasury’s Iran Sanctions page should be checked first. Individual vessels should be rechecked against OFAC sanctions lists. Military action should be distinguished through announcements by U.S. Central Command.
The verification sequence is as follows.
· Search the White House for executive orders and presidential announcements.
· Check the sanctioned targets and effective dates through OFAC.
· Check U.S. Central Command for operational announcements.
· Check EIA for volumes transiting the Strait of Hormuz.
· Cross-check actual freight rates and route changes using shipping indicators.
The Precise Meaning of the Shadow Fleet
The shadow fleet does not simply mean unregistered vessels. It also includes vessels with opaque ownership structures or insurance relationships. Suspected manipulation of the Automatic Identification System is another major characteristic. Ship-to-ship transfers themselves may be legal depending on the circumstances.
Suspicion that a vessel was used to evade sanctions does not by itself establish illegality. Sanctions designations must be checked vessel by vessel. Flag state and classification status should also be reviewed separately. Insurance and ownership companies are also identifying criteria.
Claim | Assessment | Data to Check
All shadow-fleet vessels are unregistered | Inaccurate generalization | Flag-state registries and IMO ship numbers
The entire shadow fleet is controlled by Iran | Evidence needs to be verified | OFAC designation grounds and ownership relationships
It accounts for 80% of tankers in the Strait of Hormuz | No reference date or calculation method provided | EIA transit volumes and vessel-tracking data
20% of the world’s tankers will be forced out | Scope of sanctions needs to be verified | Sanctions lists and actual operating status
Transport capacity disappears immediately upon seizure | Operations may be redirected | AIS, insurance, and flag-change records
How a Shock in the Strait of Hormuz Is Transmitted
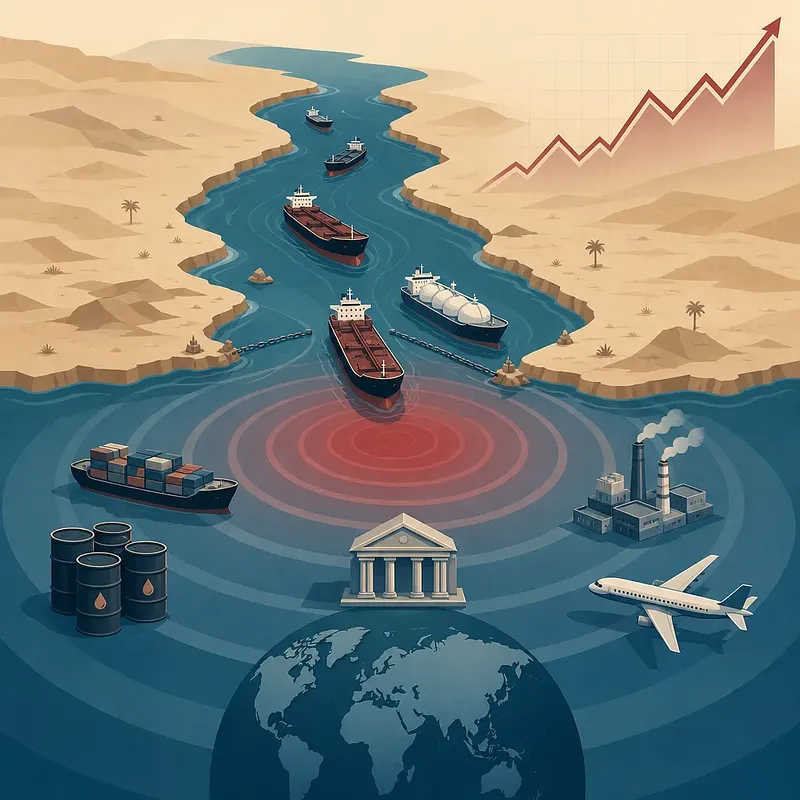
The Strait of Hormuz is a key maritime route for crude oil and petroleum products. EIA treats it as one of the world’s major oil chokepoints. Bypass pipelines have limited capacity. Instability in the strait may affect insurance premiums and freight rates first.
A shock does not unfold in only one direction. A decline in vessel supply creates upward pressure on freight rates. If the strait is completely blocked, the amount of crude oil available for transport may also fall. In that case, a surge in freight rates and a decline in cargo volumes may occur together.
The transmission channels can be categorized as follows.
· Sanctions on vessels may reduce available shipping capacity.
· Insurance restrictions constrain the vessels able to operate.
· Diversification of import sources may increase ton-miles.
· Lower crude oil production may reduce maritime cargo volumes.
· High oil prices may slow consumer and industrial demand.
Summary of the Shipbuilding Impact by Scenario
The benefits to the shipbuilding industry depend on the form of the blockade. Selective sanctions and a complete closure do not produce the same outcome. A shift to long-distance imports is favorable for ton-miles. A collapse in cargo volumes may weaken expectations for new orders.
Scenario | Impact on Tanker Market | Impact on Shipbuilding | Indicators to Check
Operations restricted only for specific sanctioned vessels | Demand for compliant shipping capacity may increase | Expectations for replacement orders may emerge | Number of sanctioned vessels and freight rates
Delays in Strait of Hormuz transit | Waiting times and insurance premiums rise | Freight-rate response precedes short-term orders | Number of transits and waiting times
Longer crude oil import routes | Ton-mile demand increases | Favorable for new orders if sustained | Transport distance by route
Complete closure of the strait | Crude oil cargo volumes may decline | Order impact is unclear | Export and production volumes
Easing of diplomatic tensions | Risk premiums may decline | Theme-driven expectations weaken | Lifting of sanctions and freight rates
Increased scrapping of older vessels | Available shipping capacity declines | Favorable for replacement orders | Scrapping volume and fleet age distribution
Calculation Example: When a 20-Day Route Becomes a 30-Day Route
When comparing only voyage durations, the calculation is simple. The existing route was presented as taking 20 days. The alternative route was presented as taking 30 days. The reference dates and ports for the two figures were not specified.
· Ratio of voyage durations: 30 days ÷ 20 days = 1.5 times
· Increase in voyage duration: 30 days − 20 days = 10 days
· Simple percentage increase: 10 days ÷ 20 days = 50%
Assuming the same cargo volume and turnaround conditions, vessel-days increase by 50%. This is a simple calculation that applies only to the route in question. It does not mean that global tanker demand increases by 50%. Ballast voyages and loading times are also omitted from the calculation.
Actual analysis should use round-trip operations. Port waiting times and maintenance days should also be included. Whether the Suez Canal is used also changes the distance. Vessel speed and cargo capacity affect turnover rates as well.
Impact on International Oil Prices and Inflation
A sharp rise in oil prices may push up transportation and production costs. However, oil exceeding $100 per barrel is not a certain outcome. The condition that it persists for at least 3 months is also closer to a forecasting assumption. Spot prices and the futures curve should be considered together.
The speed at which high oil prices pass through to inflation differs by country. Exchange rates change import prices. Taxes and subsidies also affect consumer prices. Companies’ ability to pass on costs also differs by industry.
Stagflation does not occur automatically either. The scale and duration of the oil-price shock must be established first. The responses of wages and services inflation must also be considered. Central bank responses vary depending on inflation expectations.
Indicators for Assessing a Tanker Supercycle
A supercycle cannot be confirmed by a surge in freight rates alone. Supply constraints lasting several years are required. There is a time lag between orders and deliveries. Shipowners’ financing capacity also limits orders.
The following indicators should be compared over the same period.
· Check spot freight rates for VLCCs and Suezmax tankers.
· Compare ton-mile demand by route.
· Check the tanker orderbook and delivery schedule.
· Compare the fleet by age with annual scrapping volume.
· Check shipyards’ dock slots and delivery lead times.
· Compare the direction of newbuild and secondhand vessel prices.
· Examine ship-financing interest rates and down-payment terms.
Freight rates may also surge on short-term geopolitical news. The orderbook indicates future supply. Scrapping is an indicator that confirms an actual reduction in supply. All three indicators must move together for the change to be considered structural.
Criteria for Assessing Benefits to the Korean Shipbuilding Industry
Benefits for Korean shipbuilders are not automatically assured. It is also difficult to categorically exclude the competitiveness of China and Japan. This is because market shares and dock availability differ by vessel type. Price is not the only factor shipowners consider.
Company disclosures must be reviewed to assess Korean shipbuilders. New orders should be separated by vessel type. Estimated costs should be examined alongside order values. With low-priced orders, revenue growth and earnings improvement may diverge.
Assessment Item | Positive Signal | Warning Signal
Order mix | Increase in the share of tanker orders | Mistaking orders for other vessel types for tanker orders
Newbuild prices | Increase in contracted vessel prices | Cost increases exceed vessel-price increases
Dock slots | Allocation centered on high-priced vessels | Delivery delays and production disruptions
Profitability | Lower provisions and improved profit margins | Continued backlog of low-priced orders
Exchange rates | Movements favorable to the earnings structure | Costs and hedging effects offset the benefit
Competitive landscape | Advantages in technology and delivery terms | Intensifying price competition
IMO environmental regulations are also a variable affecting replacement demand. EEXI and CII address the efficiency of existing vessels. Regulatory compliance does not mean scrapping alone. Slow steaming and retrofitting are also possible responses.
Common Mistakes and Misreadings
First, it is easy to interpret the number of sanctioned vessels as the number of vessels scrapped. Sanctioned vessels may change ownership or flag. Not all vessels physically disappear. Whether they are actually operating must be checked separately.
Second, it is easy to directly connect higher freight rates to shipbuilders’ profits. Freight rates are reflected first in the revenue of shipowners and shipping companies. Shipbuilders are affected only when new contracts are signed. There is an additional time lag before revenue is recognized.
Third, it is easy to determine scrapping timing based on average vessel age alone. The age distribution is more useful than the average. Maintenance condition and regulatory compliance also affect vessel lifespan. High vessel prices and charter rates may extend the operation of older vessels.
Fourth, it is easy to conclude that Korea is the only option. Shipowners assess price and financing together. Delivery timing and specifications also influence where orders are placed. Policy risks are reflected differently in each contract.
Signals That Would Disprove the Claim
An investment thesis should also define conditions that would disprove it. If the reverse blockade is not confirmed, the initial assumption weakens. If transit volumes remain steady, the supply shock is also limited. Declining freight rates may conflict with the hypothesis of insufficient shipping capacity.
The thesis should be reviewed again if the following signals appear.
· OFAC designates only a limited number of new vessels.
· Strait of Hormuz transit volumes remain within normal-year ranges.
· The shift to long-distance crude oil imports does not persist.
· The rise in tanker freight rates is quickly reversed.
· New deliveries increase faster than scrapping.
· Tanker orders are not confirmed as actual contracts.
· Shipbuilders’ orders do not lead to improved profit margins.
This approach separates news from investment decisions. Geopolitical events may move prices in the short term. Industry cycles must be verified through contract and supply data. A supercycle cannot be confirmed by rising share prices alone.
 Injoys