Loan Regulations and Listing Lock-In in the KRW 1.5–2.5 Billion Apartment Market
This analysis examines the strength of apartment prices in the KRW 1.5–2.5 billion range from the perspectives of fewer upgrade listings due to loan regulations and an influx of demand from lower price brackets. However, a few record-high transactions alone cannot establish a market-wide rise or the causal effect of regulations.
Under the price-tiered mortgage management framework announced in October 2025, brackets were established in which the nominal loan cap decreases as the price of a home in the Seoul metropolitan area or a regulated area rises.
The nominal cap is not the actual amount available to borrow; LTV, stress DSR, income, existing debt, and financial institution reviews also apply.
If the cash needed to purchase a higher-tier home increases, existing homeowners may abandon plans to upgrade, potentially causing listing lock-in as the number of homes for sale declines.
Record-high transactions in a low-volume market are heavily affected by scarce listings and changes in the mix of transactions, so they must be distinguished from a market-wide price increase.
Market assessments should examine transaction volume, repeated transactions for the same complex and unit size, the number of listings, whether transactions were canceled, and financing costs, rather than asking prices alone.
The phenomenon of apartments priced at 1.5 billion to 2.5 billion won trading at high prices despite lending restrictions is difficult to understand simply by saying that “demand is strong.” This is because lending limits can reduce purchasing power while also preventing existing owners from moving to higher-tier areas, thereby reducing the number of homes listed for sale.
However, this is only one possible market mechanism, not a single cause confirmed in every area. An actual assessment requires data on the scope of the regulations, transaction volume, the number of listings, and repeat transactions involving comparable homes.
The Precise Meaning of Loan Limits by Price Range
The household lending management framework announced in October 2025 included differentiated nominal mortgage limits based on housing price ranges for homes in the Seoul metropolitan area and regulated areas.
Housing price range | Nominal maximum mortgage limit | Example of simple ratio to housing price
1.5 billion won or less | 600 million won | 40% for a home priced at 1.5 billion won
More than 1.5 billion won to 2.5 billion won or less | 400 million won | 20% for a home priced at 2 billion won
More than 2.5 billion won | 200 million won | Approximately 6.7% for a home priced at 3 billion won
The amounts in this table are not guaranteed sums available to everyone. The actual loan amount may be set at the lower level resulting from the following regulations and financial institution reviews.
· Location of the home and whether it is in a regulated area
· Whether the borrower owns no home, one home, or multiple homes, and any conditions requiring the disposal of an existing home
· LTV regulations
· Stress DSR and the borrower’s income
· Total debt, including existing mortgages and unsecured loans
· The financial institution’s collateral valuation and internal credit review
· Purpose of the funds, such as purchasing a home or securing funds for living expenses
· Transitional provisions based on the policy’s effective date and the timing of the contract and loan application
Therefore, it is accurate to understand this not as “you can borrow 400 million won for a 2 billion won apartment,” but as “even after passing other reviews, the cap under this system may be 400 million won.” Because policies can change, the latest standards announced by the Financial Services Commission and applied by the relevant financial institution should be checked again before signing a contract.
How Lending Restrictions Reduce Buyer Demand
When the loan limit decreases, buyers must contribute more equity. Cash needs include not only the housing price but also acquisition tax, brokerage fees, moving expenses, and repayment of existing loans.
For example, if the loan for purchasing a 2 billion won home is limited to a maximum of 400 million won, 1.6 billion won in equity is required for the purchase price alone. If the actual available loan is less than 400 million won because of DSR requirements, the amount of cash needed increases further.
This effect can weaken the following types of demand.
· Moves to more expensive homes by owner-occupiers who rely heavily on loans
· Purchases of new homes before existing homes are sold
· Purchases by households with high incomes but insufficient immediately available financial assets
· Leveraged investment based on expectations of short-term price increases
In the segment above 2.5 billion won, the nominal loan limit is even lower, increasing the importance of cash assets. However, it cannot be assumed that all transactions in this segment will stagnate. Outcomes may vary by area depending on demand from wealthy buyers with high cash holdings, funds from gifts or inheritances, and the proceeds from the sale of existing homes.
How Halted Home Upgrades Reduce Listings
Lending restrictions may appear to apply only to buyers, but they also affect existing homeowners’ decisions to sell. Owners who planned to sell their current homes and move to more expensive ones have less reason to list their existing homes if they cannot finance the shortfall for the new homes.
Home-upgrade transactions are usually linked as follows.
· The existing home is listed for sale.
· The sale proceeds and available amount of new borrowing are calculated.
· The purchase price and transaction costs of the higher-tier home are covered.
· The final payments are made by coordinating the sale of the existing home with the purchase of the new home.
If a funding shortfall arises in the third step, the entire transaction chain may be interrupted. The resulting phenomenon is a “listing lock-up.” Although there are fewer buyers, sellers decline even faster, creating a structure in which prices do not fall easily.
However, a listing lock-up is not caused by lending restrictions alone. The following factors should also be considered.
· Transaction costs, including capital gains tax and acquisition tax
· Owner-occupancy requirements or the remaining term of a lease
· Sellers’ expectations of future price increases
· A shortage of alternative housing
· Expectations for reconstruction and redevelopment projects
· Interest rates and returns on alternative investments, such as deposits and bonds
Why a Bottleneck May Form in the 1.5 Billion to 2.5 Billion Won Segment
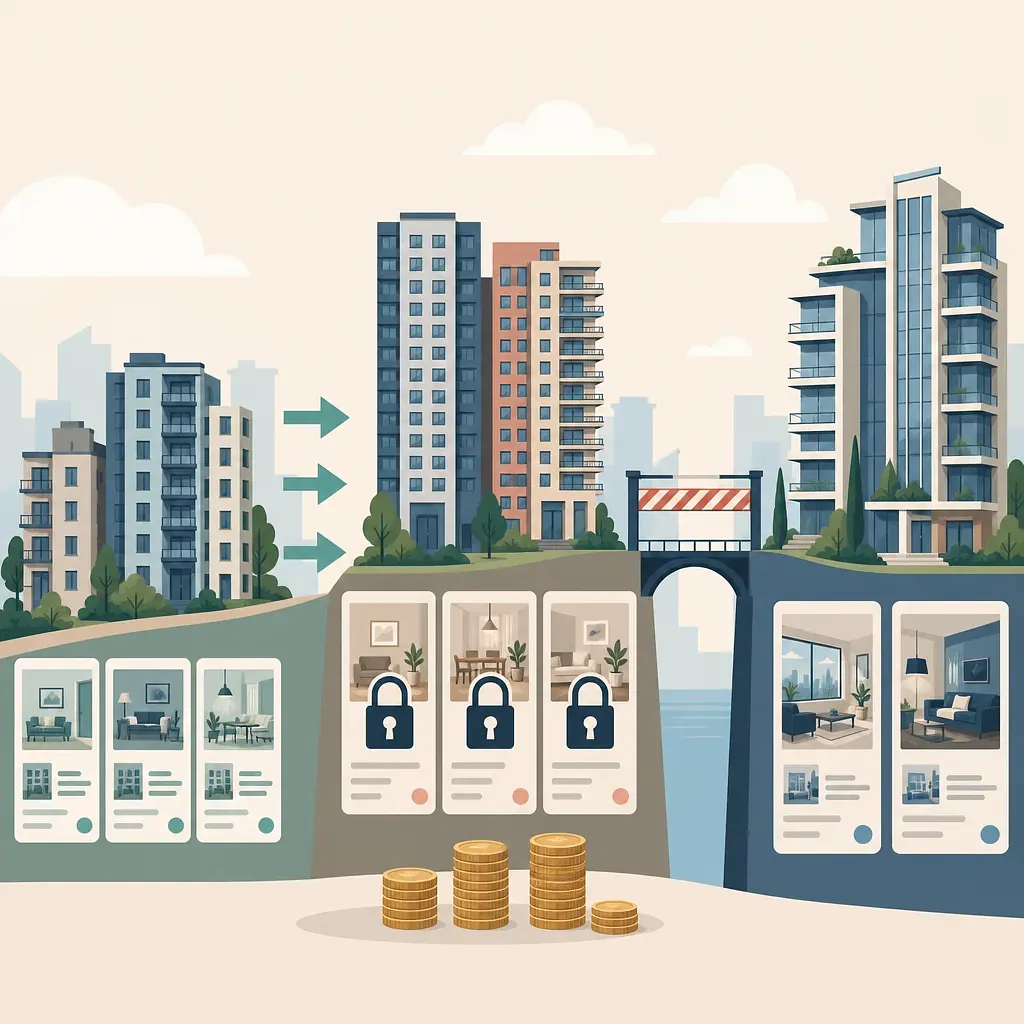
There may continue to be demand from households selling homes priced at 1.5 billion won or less and adding their own capital to move into homes priced above 1.5 billion won. In contrast, when owners of homes priced between 1.5 billion and 2.5 billion won move into homes above 2.5 billion won, they must bear a lower loan cap and a large price gap.
As a result, a bottleneck may form in which prospective buyers enter from below while fewer owners exit upward.
Market flow | Possible impact of lending restrictions | Potentially observable result
Moving from 1.5 billion won or less to above 1.5 billion won | Increased funding burden | Some reduction or delay in demand to move
Owners of homes priced at 1.5 billion to 2.5 billion won moving to higher-tier areas | Reduced loan limits for new homes | Postponement of existing home sales
Competition for scarce listings | Fewer available properties | High closing prices for certain preferred listings
Transaction cliff | Smaller sample size | One or two transactions have a major impact on indicators
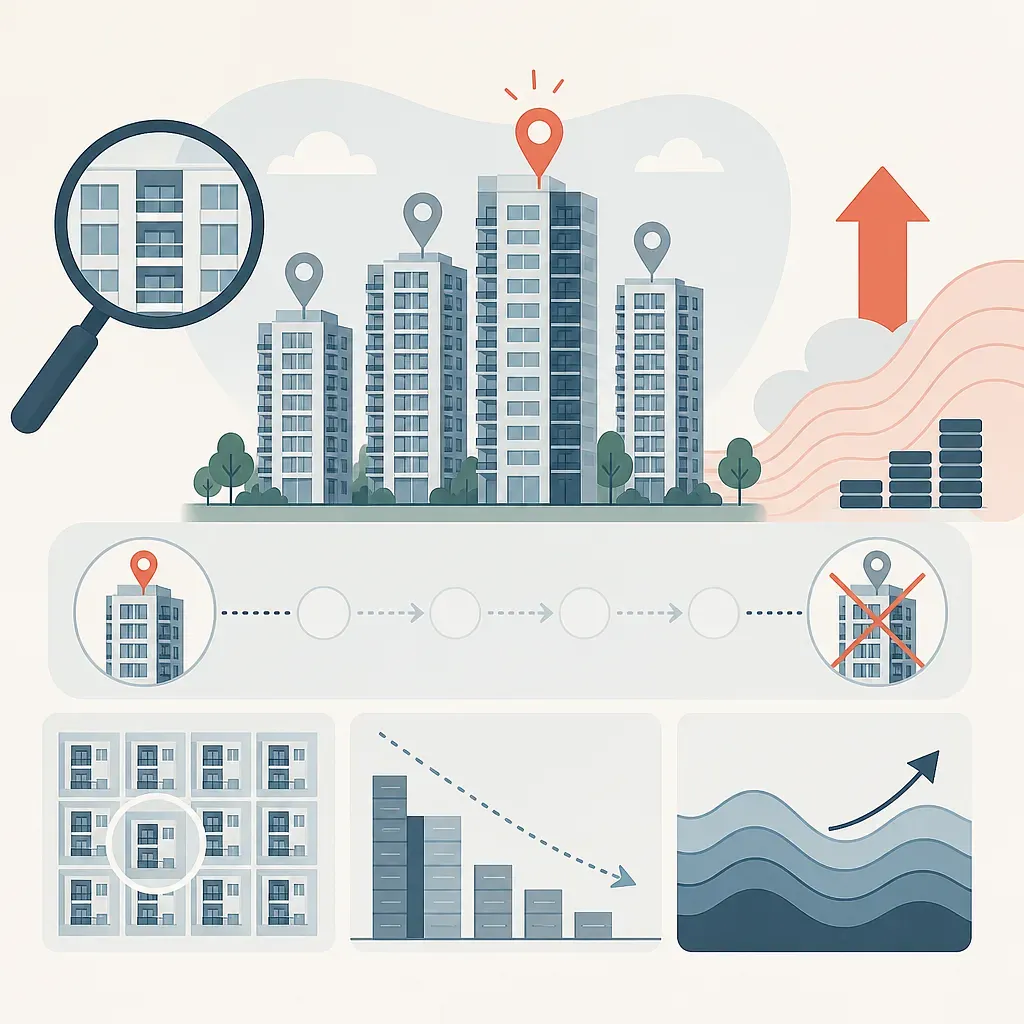
For this hypothesis to be correct, there should be a simultaneous pattern of declining listings by apartment complex and preferred homes—by building, floor, and condition—trading at high prices amid low transaction volume. Listing lock-up cannot be demonstrated merely by observing record-high transactions without data on transaction volume and listings.
Why Record-High Transactions Do Not Mean the Entire Market Is Rising
In a thinly traded market, a single record-high transaction may appear to represent the overall price level. However, even within the same apartment complex, prices can vary significantly depending on floor, orientation, view, interior renovation condition, land ownership share, and move-in availability.
The following errors should be avoided when interpreting record-high transactions.
Transaction Mix Effect
If a lower-floor or unrenovated home was traded previously and a higher-floor home in a preferred building is traded this time, an increase in the average price does not necessarily mean that the value of comparable homes has risen.
Transaction Volume Illusion
A market in which many of 100 transactions increased differs in meaning from a market in which one of two transactions set a record high. Total transaction volume and the share of transactions with price increases should be checked together with the number of record-high transactions.
Confusing Asking Prices with Actual Transaction Prices
An asking price is the seller’s desired price. When listings are scarce, asking prices may rise sharply without leading to actual contracts. Registration status and reports of contract cancellations should also be checked.
Difference Between Nominal Prices and Holding Costs
Even if purchase prices remain stable, the actual burden of ownership may increase when mortgage interest rates, taxes, maintenance fees, and opportunity costs rise.
Data for Testing the Listing Lock-Up Hypothesis
For market analysis, it is safer to combine multiple indicators than to rely on the impressions of individual real estate agencies or examples of record-high transactions.
Indicator to check | Method of interpretation | Main source
Actual apartment transaction prices | Compare repeat transactions within the same complex, size, and floor group | Ministry of Land, Infrastructure and Transport’s Actual Transaction Price Disclosure System
Monthly transaction volume | Compare transaction counts before and after the regulations with long-term averages | Ministry of Land, Infrastructure and Transport · Korea Real Estate Board
Housing price index | Check whether isolated record highs have spread across the broader area | Korea Real Estate Board R-ONE
Number of listings | Check whether actual supply for sale has declined | Cross-check public data and multiple private-sector sources
Transaction cancellations | Check whether record-high contracts remained in effect | Actual Transaction Price Disclosure System
Jeonse prices and jeonse-to-price ratio | Check owner-occupier demand fundamentals and whether the gap is widening | Korea Real Estate Board · Actual transaction data
Lending rates and household loans | Check changes in the funding environment | Bank of Korea · Financial Services Commission
The comparison period is also important. Comparing only the month immediately before the policy with the month immediately after it mixes in factors such as seasonality, changes in interest rates, and new housing supply. At a minimum, it is advisable to examine the same month of the previous year, the average over recent years, adjacent price segments, and comparable non-regulated areas.
Why It Is Difficult to Make Definitive Price Forecasts
The phenomenon in which prices in higher-tier areas rise first and adjacent areas and price ranges follow is commonly referred to as “catch-up.” However, this is not a law but a pattern observed in certain rising markets.
For the 1.5 billion to 2.5 billion won market to rise further, purchasing power sufficient to absorb the limited listings must be maintained. Conversely, prices may adjust under the following conditions even if listings remain locked up.
· Actual borrowing capacity declines further because of rising interest rates or tighter DSR requirements
· The outlook for the economy, income, and employment deteriorates
· Changes in property holding taxes or transaction taxes increase incentives to sell
· New move-in supply and redevelopment project supply increase
· Weaker expectations of price increases cause waiting listings to enter the market all at once
· Declining jeonse prices worsen owners’ cash flow
Therefore, both the claim that “prices must rise because of lending restrictions” and the claim that “prices must fall because of lending restrictions” are excessive. Prices are determined by whether the reduction in buyer demand or the reduction in seller supply is greater.
Funding Items to Check Before Moving to a New Home
When deciding whether to purchase a home, buyers must calculate the cash needed by the actual final payment date rather than relying on the nominal loan limit.
· Estimated loan amount confirmed with the relevant financial institution
· Principal and interest payments after applying stress DSR
· Proceeds from selling the existing home and the remaining loan repayment amount
· Acquisition-related taxes, including acquisition tax and local education tax
· Brokerage fees, legal fees, moving expenses, and renovation costs
· A funding buffer in case the sale of the existing home is delayed
· Tax and disposal requirements related to temporary ownership of two homes
· Monthly payments that can be afforded if interest rates rise
· Cash actually available after excluding emergency funds
A home should not be considered undervalued merely because its desired purchase price is lower than nearby record-high transactions. Comparisons should be made after adjusting for recent transactions involving the same floor area, building, floor, orientation, renovation condition, legal rights, and lease succession conditions.
Key Conclusion
A plausible hypothesis explaining the price strength of apartments priced between 1.5 billion and 2.5 billion won is that lending restrictions have reduced not only demand but also listings from owners seeking to move to more expensive homes. If owners who lack the funds to move into higher-tier homes postpone selling their existing homes, the number of homes available for purchase declines, and a small number of preferred listings may close at high prices.
However, record-high transactions alone cannot confirm this hypothesis or future price increases. Actual transaction volume, repeat prices for comparable homes, the number of listings, transaction cancellations, the jeonse market, and financing costs must all be checked together. Lending restrictions should be interpreted not as a variable that single-handedly determines the direction of prices, but as a constraint that affects both demand and supply in different ways.
 Injoys